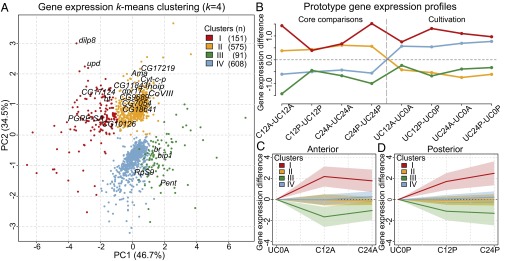
Fig. 2.

Clustering of differentially expressed genes by k-means clustering. (A) Principal component analysis plots and k-means clustering (k = 4) of 1,425 differentially expressed genes. The 20 genes from Table 1 are indicated. (B) The four clusters were created by taking into account the expression changes in both core comparisons and cultivation. (C and D) Gene expression differences between cut and cultured samples and uncut and uncultured samples are presented. The average value and variance of each cluster are shown by corresponding colored lines and pale-colored zones. PC, principal component.
