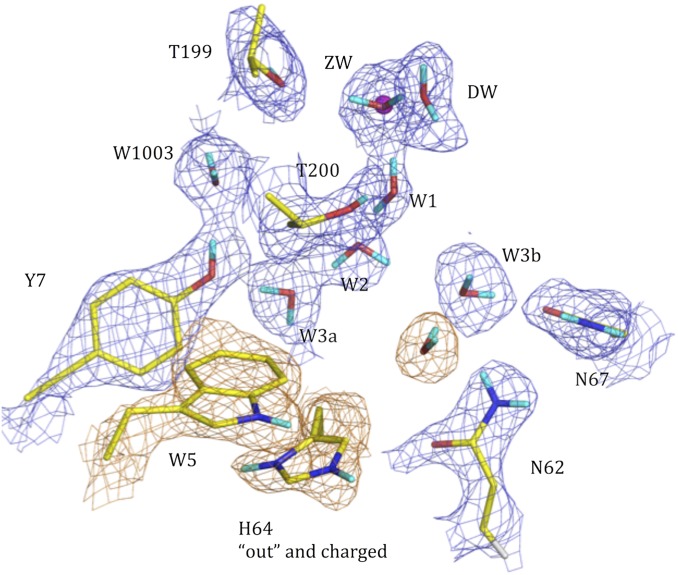
Fig. 2.
The pH 6 holo HCA II active site determined by neutron crystallographic studies. The 2Fo − Fc nuclear density map is shown in blue mesh (contour 1.3σ). Exchanged Ds are in cyan; unexchanged H atoms are not shown for clarity. Active-site residues and solvent molecules are labeled. The nuclear density for Trp5 and His64 is shown in orange.

