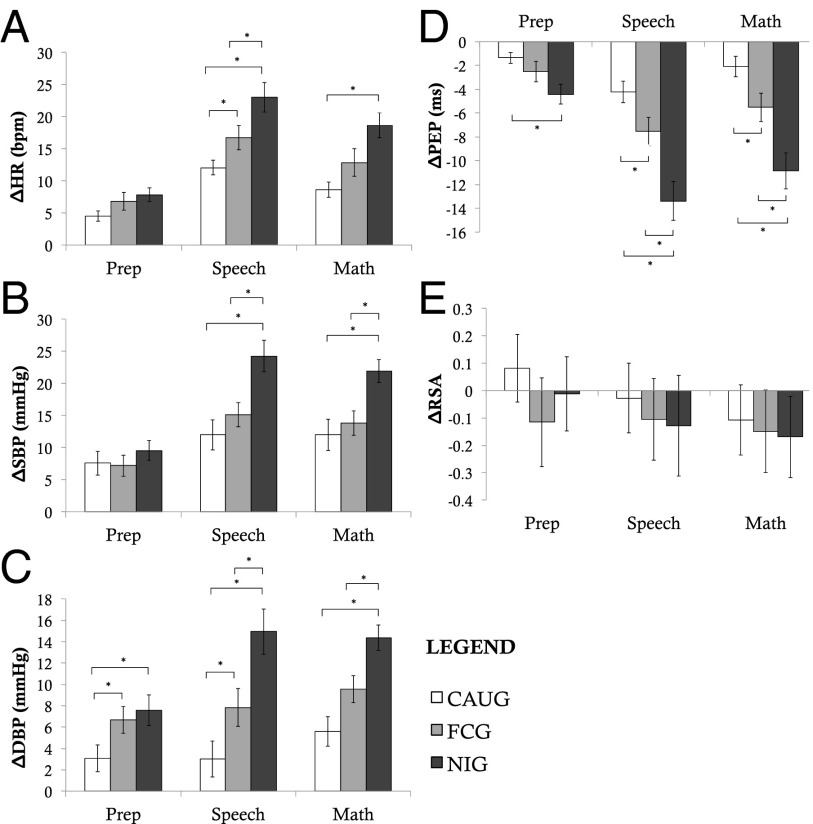
Fig. 1.
Group differences in ANS reactivity to the TSST. Figure depicts changes in ANS measures from baseline to each portion of the TSST (speech preparation, speech, and math). A depicts changes in heart rate; B depicts changes in systolic blood pressure; C depicts changes in diastolic blood pressure; D depicts changes in pre-ejection period; and E depicts changes in respiratory sinus arrhythmia. *P < 0.05, two-sided test.

