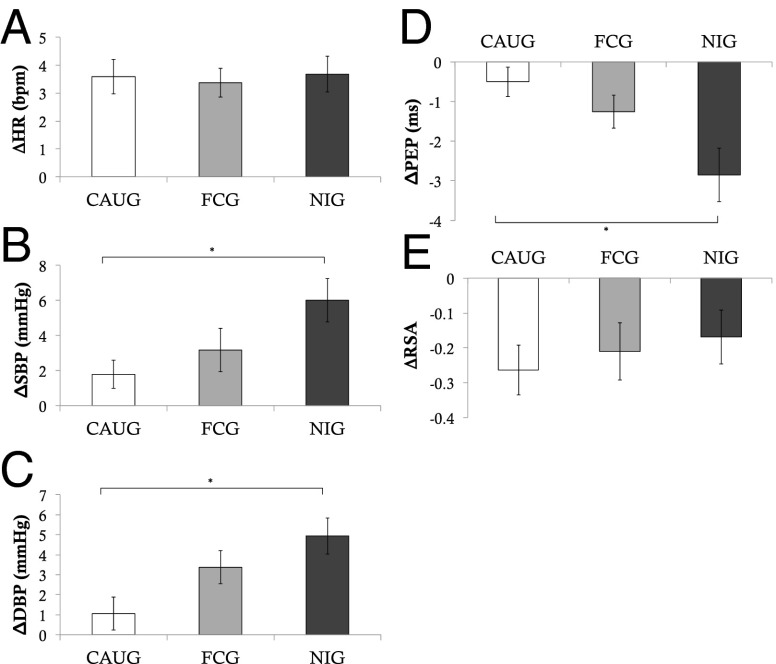
Fig. 2.
Group differences in ANS reactivity to peer evaluation. Figure depicts changes in ANS measures from baseline to the peer evaluation task. A depicts changes in heart rate; B depicts changes in systolic blood pressure; C depicts changes in diastolic blood pressure; D depicts changes in pre-ejection period; and E depicts changes in respiratory sinus arrhythmia. *P < 0.05, two-sided test.

