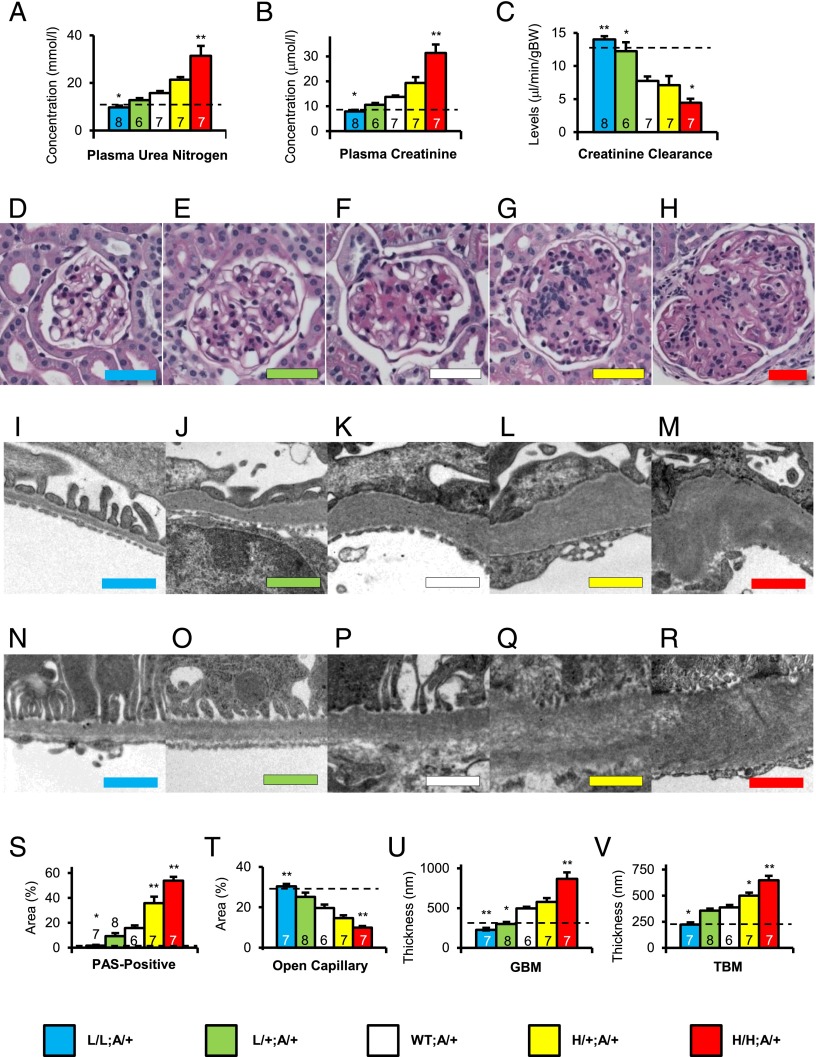
Fig. 2.
Renal excretory function, glomerular histology and ultrastructure at 40 wk of age in Akita mice with five levels of Tgfb1 expression. (A) Plasma urea nitrogen concentration. (B) Plasma creatinine concentration. (C) Creatinine clearance. (D–H) Glomerular histology; periodic acid-Schiff (PAS) staining with hematoxylin. (Color-coded scale bar: 50 μm) (D) L/L:A/+. (E) L/+:A/+. (F) WT:A/+. (G) H/+:A/+. (H) H/H:A/+. (I–M) Glomerular basement membrane ultra-structure; color-coded scale bar = 1 μm. (I) L/L:A/+. (J) L/+:A/+. (K) WT:A/+. (L) H/+:A/+. (M) H/H:A/+. (N–R) Peri-tubular basement membrane ultra-structure; color-coded scale bar = 1 μm. (N) L/L:A/+. (O) L/+:A/+. (P) WT:A/+. (Q) H/+:A/+. (R) H/H:A/+. (S–V) Renal phenotypes in nondiabetic and diabetic mice of the five Tgfb1 genotypes. (S) Fraction of PAS-positive mesangial material per total glomerular tuft cross-sectional area. (T) Fraction of open capillary area per total glomerular tuft cross-sectional area. (U) Thickness of glomerular basement membrane (GBM). (V) Thickness of tubular basement membrane (TBM) in the proximal tubule. Bars and images are color coded as indicated. Dotted lines indicate nondiabetic WT levels. *P < 0.05, **P < 0.01 vs. WT:A/+.

