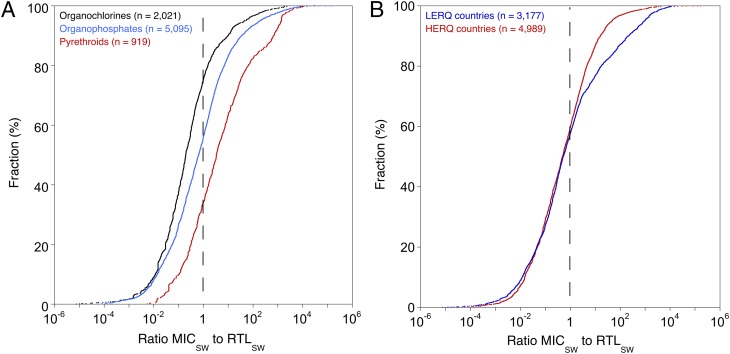
Fig. 3.
Effect of insecticide class and country environmental regulations on the distribution curves for reported measured insecticide concentrations in the water phase (MICSW) relative to substance-specific regulatory threshold levels (RTLSW). (A) Black represents data obtained for organochlorine insecticides (n = 2,021), blue represents data obtained for organophosphate insecticides (n = 5,095), and red represents data obtained for pyrethroid insecticides (n = 919); 6.1% of the MICSW of neonicotinoids (n = 131) exceeded the RTLSW (not displayed). (B) Distribution curves for MICSW relative to substance-specific RTLSW. Blue represents concentrations measured in countries with low environmental regulatory quality (LERQ; n = 3,177), and red represents data measured in countries with high environmental regulatory quality (HERQ; n = 4,989). The vertical dashed lines indicate the RTLSW.

