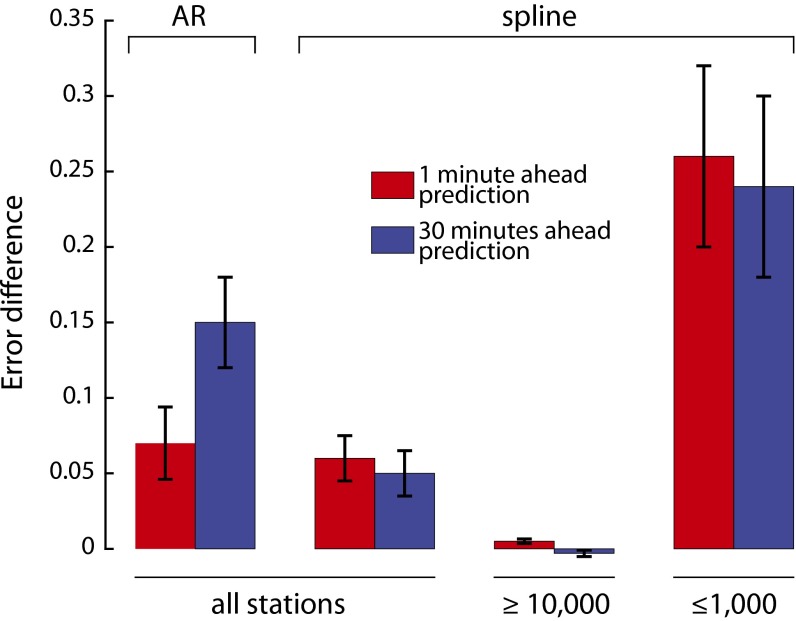
Fig. 1.
RMSE difference per load between (i) the AR model and the tracking model and (ii) spline model and the tracking model. Fivefold cross-validation averages for 1-min- and 30-min-ahead predictions. Higher numbers mean an improvement given by the tracking model. Error bars show a 95% confidence interval (3 SEs).

