Fig. 2.
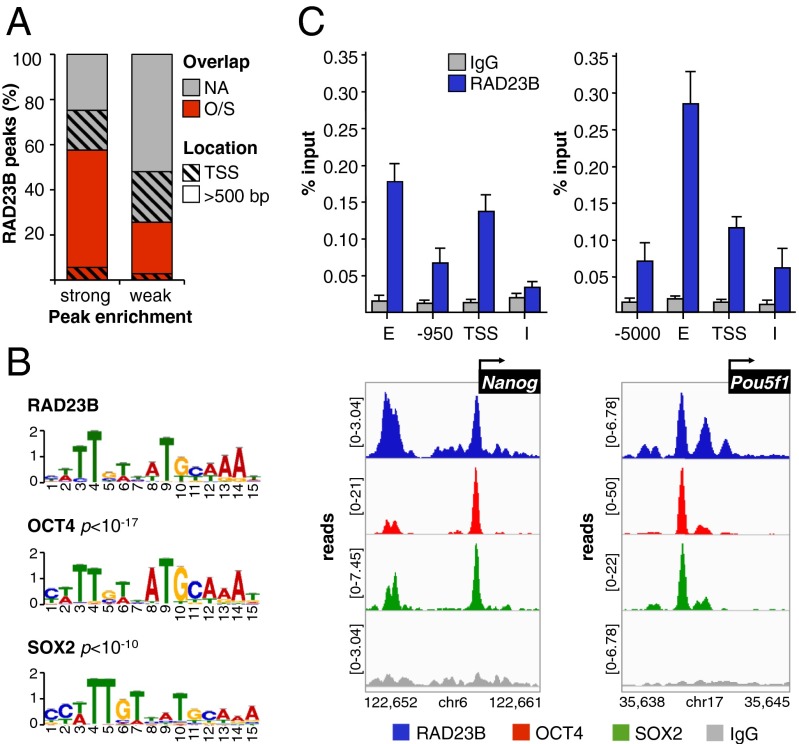
RAD23B and OCT4/SOX2 extensively colocalize in mESCs. (A) Percentage of RAD23B ChIP-seq peaks that do (O/S) or do not (NA) overlap with OCT4/SOX2 (24) binding sites in D3 mESCs. RAD23B peaks are split in two groups depending on their enrichment over IgG control (Partek P value < 10−9 and 10−9 < P < 10−5). The black pattern identifies the location of peaks with respect to gene TSS. (B) Sequence analysis of OCT4/SOX2-overlapping RAD23B binding sites (peak midpoint ±125 bp) by MEME and TOMTOM motif discovery and comparison tools. (C) Co-occupancy of RAD23B, OCT4, and SOX2 proteins at Nanog (Left) and Oct4/Pou5f1 (Right) loci evaluated by ChIP-qPCR (Upper) (11), and ChIP-seq (Lower). IGV-computed ChIP-seq tracks (71, 72) are plotted as (number of reads) × [1,000,000/(total read count)]; data range for each track is specified on the y axis. Genomic coordinates are in kilobases. Normal IgG (gray) controls for specificity. See Fig. S3 for additional loci. E, distal enhancer; I, intron; TSS, proximal promoter.

