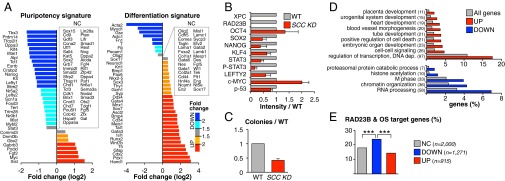
Fig. 4.

Transcription profile of SCC knockdown mESCs. (A) Comparative expression of pluripotency (Left) and differentiation (Right) markers between SCC KD and WT mESCs, evaluated by RNA-seq. Genes whose expression is not changed (NC) are listed in boxes. Plotted is the log2 ratio of SCC KD and WT RPKM counts (details on SCC KD generation in Fig. S4; global pairwise comparisons of RPKM values in Fig. S5A; qPCR validation of selected genes in Fig. S5B; full gene list in Dataset S2). (B) Protein levels of selected genes in SCC KD vs. WT mESCs, β-actin normalized. Plotted are average signal and SD of two independent Western blots quantified by ImageJ (representative blot in Fig. S5C). P-STAT3, antibody detecting active, Tyr705-phosphorylated STAT3. Analysis of p-53 targets in Fig. S5G. (C) Clonal assays in SCC KD compared with WT mESCs. Plotted is the number of AP+ colonies obtained from plating 300 cells in six-well plates (average and SD of three independent experiments). (D) GO analysis of genes up-regulated (UP) and down-regulated (DOWN) in SCC KD mESCs compared with all annotated genes. Bracketed is the number of deregulated genes belonging to each category. EASE (Expression Analysis Systematic Explorer) scores < 0.01 for all categories (complete table in Dataset S2). (E) Percentage of genes bound by RAD23B and OCT4/SOX2 within 5 kb from their TSS among genes either not changed (NC), down-regulated (DOWN), or up-regulated (UP) upon SCC KD. The number of genes in each category is specified (n). ***P < 10−3, two-sample test for equality of proportions with continuity correction. Data of SCC KD mESCs are average of two independent Xpc shRNA constructs in Rad23b−/− mESCs.
