Significance
Absorption-based X-ray tomography suffers from low contrast for soft tissue. Over the last few years, it has been shown that grating-based phase-contrast X-ray tomography can overcome this limitation. Here we present, to our knowledge, the first phase-contrast tomography acquired at a compact light source, a recently developed compact synchrotron based on inverse Compton scattering.
Keywords: phase-contrast tomography, dark-field tomography, grating interferometer, inverse Compton X-rays, X-ray imaging
Abstract
Between X-ray tubes and large-scale synchrotron sources, a large gap in performance exists with respect to the monochromaticity and brilliance of the X-ray beam. However, due to their size and cost, large-scale synchrotrons are not available for more routine applications in small and medium-sized academic or industrial laboratories. This gap could be closed by laser-driven compact synchrotron light sources (CLS), which use an infrared (IR) laser cavity in combination with a small electron storage ring. Hard X-rays are produced through the process of inverse Compton scattering upon the intersection of the electron bunch with the focused laser beam. The produced X-ray beam is intrinsically monochromatic and highly collimated. This makes a CLS well-suited for applications of more advanced––and more challenging––X-ray imaging approaches, such as X-ray multimodal tomography. Here we present, to our knowledge, the first results of a first successful demonstration experiment in which a monochromatic X-ray beam from a CLS was used for multimodal, i.e., phase-, dark-field, and attenuation-contrast, X-ray tomography. We show results from a fluid phantom with different liquids and a biomedical application example in the form of a multimodal CT scan of a small animal (mouse, ex vivo). The results highlight particularly that quantitative multimodal CT has become feasible with laser-driven CLS, and that the results outperform more conventional approaches.
With the introduction of the grating interferometer (1–3), the field of X-ray phase-contrast imaging has seen great advances in the past decade. In comparison with conventional attenuation-contrast imaging, the phase-contrast modality greatly improves soft-tissue contrast, which can, for example, be used for better tumor visualization (4). With the development of the Talbot–Lau interferometer, grating-based phase-contrast imaging has become feasible not only with synchrotron sources, but also with standard X-ray tube sources (3, 5). On the downside, the visibility is degraded due to the broad polychromatic spectrum of the X-ray tube sources, thus compromising the image quality. Brilliant and highly monochromatic synchrotron sources yield superior results for high-resolution and high-sensitivity measurements (2, 4, 6–13).
However, limited availability, high cost, and small fields of view make synchrotron sources incompatible with clinical applications or preclinical research on, e.g., small-animal disease models in close vicinity to biomedical laboratories with small-animal infrastructure. Offering a monochromatic beam as well as higher brilliance and coherence than X-ray tube sources, compact synchrotron sources can be classified between tube sources and synchrotron sources. These features are achieved with a compact light source (CLS), which has a size that is compatible with conventional laboratories, making it an interesting candidate for preclinical and materials science applications of phase-contrast imaging. The small footprint, combined with a far lower total investment compared with a synchrotron source, facilitates the integration and therefore allows for direct availability at existing research facilities or in industry. X-rays are generated in the process of inverse Compton scattering (14) each time an electron bunch circulating in a miniature storage ring and a laser beam stored in a high-finesse bow-tie cavity collide. The produced X-ray beam is intrinsically monochromatic and coherent and offers a field of view suitable for imaging of macroscopic samples, providing suitable conditions for grating-based X-ray imaging of biomedical or material samples.
First studies using a grating interferometer at a CLS yielded promising results for phase-contrast and dark-field projection images (15–18). Quantitative attenuation-based CT demonstrated the capability of the CLS to overcome beam hardening issues and to provide precise density values (19). The characteristics of a CLS would also allow for propagation-based phase-contrast imaging, and we plan to evaluate perspectives in future studies.
Here we show, to our knowledge, the first grating-based computed tomography scans obtained with a CLS. Because tomographic imaging with a grating interferometer at a monochromatic source simultaneously yields quantitative information on linear attenuation coefficient, refractive index decrement, and linear diffusion coefficient, it allows discrimination of substances that cannot be distinguished solely by their attenuation coefficient and yields increased soft-tissue contrast for biomedical samples. These performance gains are demonstrated in this study. We present a quantitative analysis of a fluid phantom and a tomography scan of a biomedical sample. Moreover, we show that image quality of the phase signal can strongly be improved by applying an iterative reconstruction algorithm that reduces stripe issues and noise.
Results
Fluid Phantom.
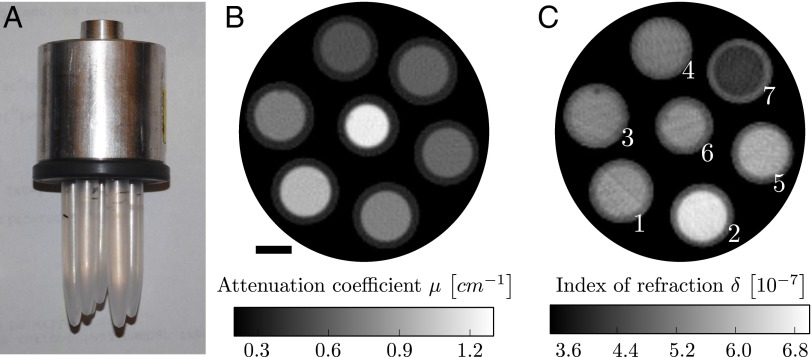
Fig. 1 B and C displays reconstructed slices of the linear attenuation coefficient and the refractive index decrement of the fluid phantom, a photograph of which is shown in Fig. 1A. The images show an average of 10 slices for improved statistics and therefore signal-to-noise ratio. The same improvement could have been achieved by extending the exposure times. The differential phase-contrast (DPC) reconstruction has some streak artifacts, which are caused by strong phase shifts at plastic–air interfaces, but these could be avoided by placing the sample in a water bath during image acquisition or by using iterative reconstruction schemes (20). The fluids cannot be distinguished from visual inspection of solely the attenuation image or the DPC image by themselves, because the gray values do not exhibit enough contrast. Fluids that show a strong contrast in the DPC image have similar gray values in the attenuation image and vice versa.
Fig. 1.
(A) Photograph of the fluid phantom. It consists of seven polyethylene rods containing seven different, chemically well-defined fluids (Table S1). (B and C) Average of 10 reconstructed slices of the linear attenuation coefficient μ (B) and the refractive index decrement δ (C). Fluids with similar attenuation coefficient show strong contrast in the phase image and vice versa. (Scale bar, 3 mm.) The white numbers in C correspond to the fluid sample number used in Table 1 and Table S1.
To identify the different fluids, a quantitative analysis is necessary. For this purpose, the mean value of a region of interest (ROI) and its respective SD were calculated for each fluid sample and for each of the two imaging modalities. The results are given in Table 1 and compared with values calculated using Eqs. 1 and 2. The measured and the calculated values show very good agreement. The mismatch for the attenuation values is less than and within the error margin of the measured values. For the refractive index decrement, the maximum mismatch between measured and calculated values is . The higher deviation from calculated values for the refractive index decrement could be caused by the mentioned streak artifacts.
Table 1.
Linear attenuation coefficient μ and refractive index decrement δ
| Sample | ||||
| 1 | 7.23 | 5.21 | ||
| 2 | 7.47 | 6.44 | ||
| 3 | 6.40 | 5.73 | ||
| 4 | 5.50 | 5.12 | ||
| 5 | 9.60 | 5.36 | ||
| 6 | 12.07 | 5.15 | ||
| 7 | 6.11 | 4.24 |
The subscripts m and c denote measured and calculated values, respectively. The error margin for the measured values was calculated from the SD of the respective region of interest.
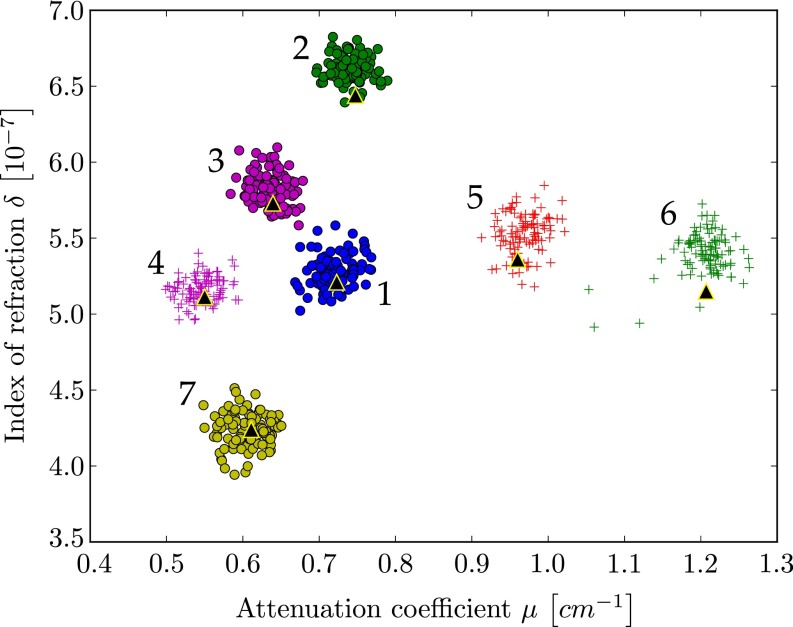
The quantitative analysis is further illustrated in the scatter plot shown in Fig. 2. The scatter plot displays μ- and δ-values from every pixel within the chosen ROIs. The calculated theoretical μ- and δ-values are displayed as large black triangles. It is visible from the scatter plot that substances with overlapping attenuation values can be separated by their refractive index and vice versa. This indicates that quantitative multimodal imaging of attenuation and phase is most helpful to distinguish materials with similar attenuation coefficient or similar refractive index decrement.
Fig. 2.
Scatter plot displays the attenuation coefficient and refractive index decrement for all pixels in the ROIs in the fluid phantom reconstructions (compare Fig. 1 B and C). Black triangles are the calculated values. Most substances show an overlap in either attenuation or phase signal alone, but all substances can clearly be distinguished using the combined information from both attenuation and phase. The different data clusters are labeled by numbers as used in Table 1 and Table S1.
Fixated Mouse.
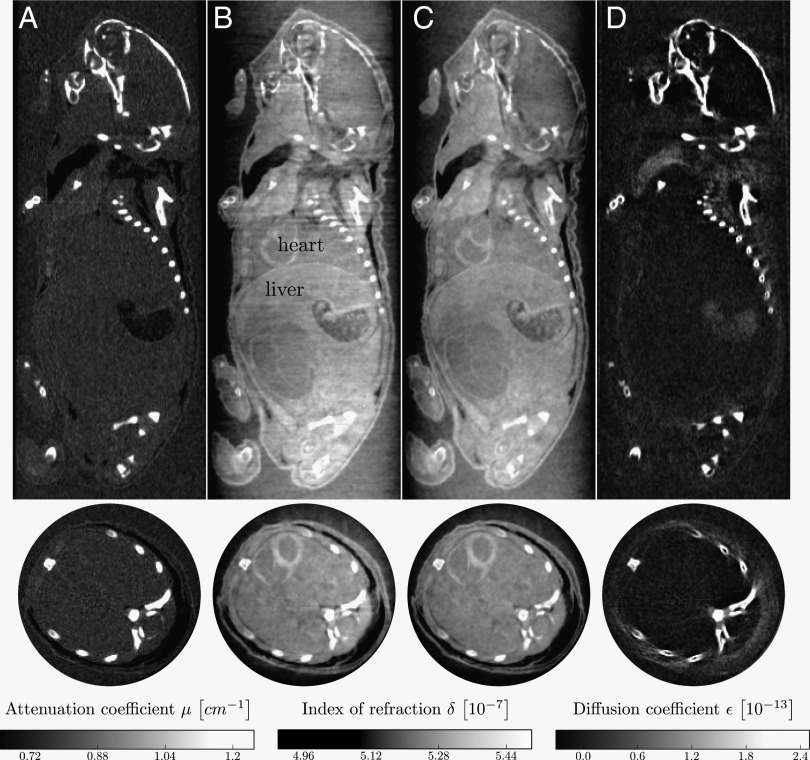
Reconstruction results for a biological sample (a fixated infant mouse, ex vivo) are presented in Figs. 3 and 4. The figures display sagittal and axial views of the three imaging modalities: attenuation contrast (Figs. 3A and 4A), phase contrast (Figs. 3 B and C and 4 B and C), and dark-field contrast (Figs. 3D and 4D). In contrast with the phase-contrast images (Figs. 3B and 4B) which were reconstructed with a standard filtered backprojection (FBP) algorithm, the images (Figs. 3C and 4C) were reconstructed with an iterative reconstruction scheme (20). The phase-contrast images processed with a standard FBP algorithm (Figs. 3B and 4B) display strong streak artifacts caused by the bones. Comparison of the images shows that the iterative reconstruction strongly reduces stripe artifacts and noise compared with the FBP reconstruction. Moreover, artifacts stemming from structures inducing a high phase shift, such as the soft tissue–bone interface, are removed well by the iterative algorithm. The image quality benefits significantly from the use of the iterative reconstruction technique.
Fig. 3.
Reconstructed slices of a grating-based, multimodal CT scan of a biological sample (a formalin fixated infant mouse). Shown are sagittal (Top Row) and axial (Bottom Row) slices. The reconstruction yields quantitative values of linear attenuation coefficient μ (A), refractive index decrement δ (B and C), and linear diffusion coefficient ε (D). For the phase image (C), an iterative reconstruction scheme (20) was used instead of conventional FBP reconstruction to reduce stripe artifacts and noise. (Scale bar, 2 mm.)
Fig. 4.
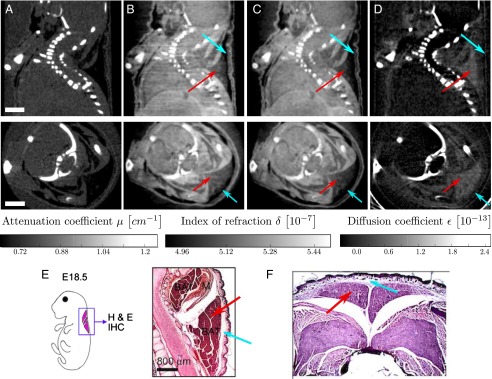
Reconstructed slices of a grating-based, multimodal CT scan of a biological sample (a formalin fixated infant mouse), in analogy to Fig. 3. Shown are sagittal (Top Row) and axial (Bottom Row) slices. The images show that brown adipose tissue is visible and can be discriminated from white adipose tissue in phase contrast (B and C) and dark-field contrast (D), but not in absorption contrast (A). (Scale bar, 2 mm.) Histological slices presented in E and F support this claim. E shows a sagittal section of the cervical/thoracic area stained with H&E of a mouse embryo (adapted from ref. 21). F shows an axial section of the interscapular area stained with H&E of a mouse embryo (adapted from ref. 22). Red arrows indicate brown adipose tissue; blue arrows indicate white adipose tissue.
The conventional attenuation contrast image (Fig. 3A) gives good image contrast for bone structures. However, barely any information on the internal organs located in the lower part of the mouse’s body can be drawn from this image. It is clear that the phase-contrast images (Fig. 3B and C) provide superior soft-tissue contrast compared with the attenuation contrast image (Fig. 3A). Several internal organs such as the heart and the liver and structures within the organs can be recognized in the phase-contrast images, but not in the attenuation image, in the sagittal as well as in the axial images. The dark-field image (Fig. 3C) displays strong scattering at the bones and at air-filled organs.
With the slices chosen in Fig. 4, we point out that, with phase contrast and dark-field contrast, brown adipose tissue and white adipose tissue are visible and can be discriminated. Comparing the phase-contrast and dark-field contrast images (Fig. 4 B–D) to histology images (Fig. 4 E and F, adapted from refs. 21 and 22, respectively), the brown and white adipose tissue in the interscapular region can clearly be identified, which is indicated with red and blue arrows, respectively. Whereas their attenuation is too similar to allow the discrimination between brown and white adipose tissue, they have a different refractive index decrement. Scattering takes places for brown but not for white adipose tissue.
Discussion
With multimodal tomography measurements of a fluid phantom at a laser-driven miniature synchrotron, we showed that combined analysis of both attenuation and phase provides a significant gain in information on different materials in the sample. Different fluids, which cannot be distinguished using solely the information obtained from either attenuation- or phase contrast, can clearly be differentiated making use of the combined information.
Quantitative values of the linear attenuation coefficient and the refractive index decrement match very well with calculated theoretical values. We assume that the remaining small discrepancy from calculated values for the refractive index decrement could be further reduced using an iterative reconstruction algorithm to remove present stripe artifacts. Importantly, the measurement and calculation procedure is by far more accurate with the monochromatic beam of a CLS compared with measuring with a polychromatic X-ray tube source (23–25). Whereas a measurement of absorption coefficient and electron density normally requires an energy calibration using tabulated values, this step is not necessary for measurements obtained at a CLS because of the quasi-monochromatic beam, allowing a direct comparison with literature values. The quantitative analysis in a scatterplot is facilitated because attenuation-contrast and phase-contrast images recorded with a grating interferometer are intrinsically perfectly registered.
Furthermore, we demonstrate the applicability of monochromatic grating-based tomography for biomedical samples. We present, to our knowledge, the first multimodal computed tomography acquired at a CLS. For a fixated infant mouse, quantitative values for the linear attenuation coefficient, the refractive index decrement, and the linear diffusion coefficient were reconstructed. Results show that especially the reconstruction of the refractive index decrement yields superior soft tissue contrast compared with the conventional attenuation image. We show that using an iterative reconstruction algorithm instead of FBP even improves the phase reconstruction and successfully removes stripe artifacts and noise.
The dose that was estimated to 2.14 Gy is significantly higher than the dose that is suggested for subsequent in vivo scans of mice, which should be below 500 mGy (26) but below the dose of 5–9 Gy (27). The dose is defined as the dose which is lethal for 50% of the mice within 30 d.
In the future, the dose could strongly be reduced by optimizing the gratings, by reducing scan time (shorter exposure times, fewer projections), and by using a more efficient detector.
In summary, the results show that a compact synchrotron source is a very promising X-ray source that could close the gap between conventional X-ray tubes and large-scale synchrotron facilities. With a footprint suitable for normal laboratory sizes, it provides a level of coherence and monochromaticity otherwise only available at synchrotrons. The beam size, emerging as a cone from the small, round source, can be significantly larger in two dimensions than beams at synchrotron sources. This area beam is beneficial for biomedical imaging, as it allows imaging of small animals such as mice without requiring stitching of images. Besides biomedical applications such as preclinical research on emphysema (18) and breast cancer diagnostics (17) using the scattering signal, grating-based tomography at the CLS yielding multimodal images appears to be a valuable tool for quantitative analysis of both materials science and biomedical samples.
Materials and Methods
CLS.
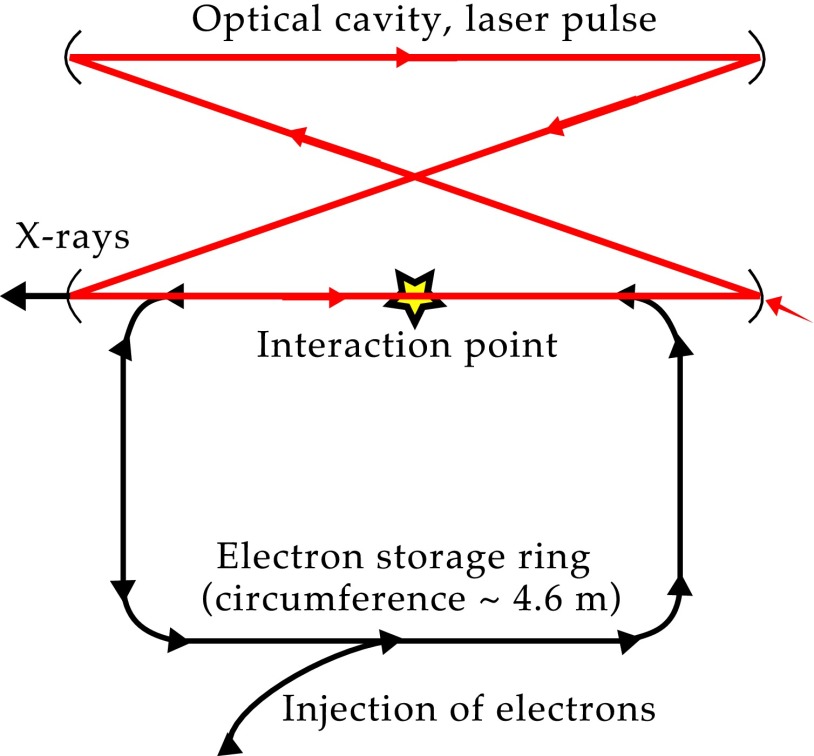
A CLS is a laser-driven, compact synchrotron source. X-rays are generated through the process of inverse Compton scattering, where an X-ray photon is generated through collision of a laser photon with an electron. A CLS is composed of a miniature electron storage ring with a circumference of a few meters and a high-finesse bow-tie laser cavity located at one of the straight sections of the storage ring, which is resonantly driven by an IR laser, as shown schematically in Fig. 5. Electrons are produced in a radiofrequency electron gun and are accelerated to an energy of 20–45 MeV in a linear accelerator section before they are stored in the ring at this energy. The electron bunches and the laser pulse collide at the interaction point on each revolution of the electrons and each cycle of the laser pulse (14). The emitted spectrum is similar to that of a long magnetic undulator with fundamental wavelength , where and γ denote laser wavelength and electron energy given in units of rest mass, respectively (28). High flux and a small source size () are achieved by tight focusing of electron bunch and laser pulse. A high degree of spatial coherence and the intrinsic energy bandwidth of make a CLS well-suited for monochromatic refraction-based imaging (15–18). The angular divergence of 4 mrad yields a circular field of view of ∼6 cm at a distance of 16 m from the source, allowing for measurement of relatively large biological samples. The measurements were performed at a CLS prototype developed and manufactured by Lyncean Technologies, Inc. The average total flux during the acquisition of the tomograms was ph/s and total flux, source size, and source position were stable over time periods of 8 h (fluctuation 5% rms). The total flux as achieved at the CLS prototype during the measurements is smaller than the theoretically predicted value (14) but performance enhancements have improved and are further expected to improve acquisition time as the technology continues to mature. The average flux has increased by about a factor of 3 since the data were taken.
Fig. 5.
Schematic drawing of the CLS as manufactured by Lyncean Technologies, Inc. An electron bunch is injected into and then stored in the electron storage ring. A laser pulse is stored in the optical cavity and collides with the electron bunch at the interaction point, producing a quasi-monochromatic X-ray beam.
Grating Interferometer.
The tomographies were recorded with a Talbot grating interferometer which was located 16 m from the interaction point. The interferometer consisted of a Ni phase grating with a period of 5.3 μm and a phase shift of (design energy 23 keV) and a Au analyzer grating with a period of 5.4 μm. The intergrating distance was 278 mm (first fractional Talbot distance). The mean energy of the CLS was keV (), with a full energy spread of .
Fluid phantom scan.
The phantom consisted of seven polyethylene tubes filled with chemically well-defined fluid and salt combinations of known weight fractions, . A photograph of the phantom is shown in Fig. 1A and the chemical composition of the seven fluids is given in Table S1. The theoretical values for the mass attenuation coefficient and the refractive index decrement can be calculated (23, 24):
| [1] |
| [2] |
where λ is the X-ray wavelength, is the classical electron radius, is the Avogadro atomic number, is the atomic mass of the constituent, and is the total number of electrons of the constituent. All tabulated data were obtained from the program XCOM (NIST; physics.nist.gov/PhysRefData/Xcom/Text/intro.html). The linear attenuation coefficient is calculated using the density of the samples (compare Table S1).
Two hundred projections over 360° were recorded. For each projection, a phase-stepping scan of five steps over one grating period was performed, with an exposure time of 5 s per image. Flat-field images were acquired before, after, and in the middle of the tomography scan. The total acquisition time was roughly 2 h. The scan was acquired with a PILATUS 100K detector (Dectris Ltd.) with a pixel size of 172 172 resulting in a spatial resolution of 167 167 167 in the reconstruction when the detector resolution and the object magnification are taken into account. The visibility was 37%.
Mouse scan.
An infant mouse was fixated in formalin in a falcon tube. The tomography consisted of 361 projections over 180.5°. For each projection, a phase-stepping scan over one grating period was recorded, with an exposure time of 8 s per image. The number of phase steps was six; however, the last image was omitted throughout processing because it was identical to the first one. Flat-field images were recorded before, after, and in the middle of the tomography scan, yielding a mean visibility of 42%. The total acquisition time was about 8 h. A Mar CCD detector (Rayonix) with a nominal resolution of 79.59 was used, resulting in a spatial resolution of 77 77 77 in the reconstruction when the detector resolution and the object magnification are taken into account.
For both scans, the pixel size is large compared with the blur introduced by the source; therefore, this contribution to the spatial resolution was neglected. About 30–40% of the given acquisition times can be attributed to motor movement. The achieved visibilities of 37% and 42%, respectively, are limited by the transverse coherence length, i.e., source size (29), and grating quality.
Reconstruction.
Multimodal projections of the samples were calculated using standard Fourier processing (3). The tomography reconstruction was done using FBP with a Ram–Lak filter for the attenuation projections and a Hilbert filter for differential phase projections.
In addition, an iterative reconstruction scheme (20) was used for the phase-contrast images of the mouse, to reduce stripe artifacts and noise in the reconstruction. Attenuation, differential phase, and dark-field values in each pixel and the respective uncertainties are acquired from an analytical weighted least-squares minimization, in accordance with the Fourier processing routine. The uncertainties are propagated from the initial Poisson counting statistics in each pixel, . Reconstruction was performed through the optimization of penalized weighted least squares, using 25 iterations and a Huber regularization with a weighting factor of and (20).
Dose Estimate for Mouse Scan.
From flat-field images taken with the PILATUS 100K detector, an average flux of photons has been estimated, where the efficiency of the detector as well as the attenuation of the two gratings and the surrounding air has been taken into account. The absorbed dose for the whole sample (mouse and formalin fixation) was calculated as 5.94 mGy per projection (five phase steps with 8-s exposure time), assuming the average density of the sample to be . This gives an absorbed dose of 2.14 Gy for the full tomography scan. This first DPC-CT scan was not dose-optimized and the dose can be significantly decreased, for example by reducing the support thickness of the grating structures and by reducing the exposure time and number of projections.
Supplementary Material
Acknowledgments
E.E., S.S., M.B., K.A., and F.P. acknowledge financial support through the DFG Cluster of Excellence Munich-Centre for Advanced Photonics and the European Research Council (FP7, Starting Grant 240142). This work was partly carried out with the support of the Karlsruhe Nano Micro Facility (www.knmf.kit.edu), a Helmholtz Research Infrastructure at Karlsruhe Institute of Technology (www.kit.edu/index.php). The Compact Light Source experiment was supported in part by Grant R44-GM074437 from National Institute of General Medical Services (NIGMS) and Grant R43-RR025730 from National Center for Research Resources (NCRR).
Footnotes
Conflict of interest statement: The contributions of R.D.R. to this publication were as a paid consultant of Lyncean Technologies, Inc., and were not part of his Stanford University duties or responsibilities.
This article is a PNAS Direct Submission.
This article contains supporting information online at www.pnas.org/lookup/suppl/doi:10.1073/pnas.1500938112/-/DCSupplemental.
References
- 1.Momose A, et al. 2003. Demonstration of X-ray Talbot interferometry. Jpn J Appl Phys 42(7B):L866–L868.
- 2.Weitkamp T, et al. X-ray phase imaging with a grating interferometer. Opt Express. 2005;13(16):6296–6304. doi: 10.1364/opex.13.006296. [DOI] [PubMed] [Google Scholar]
- 3.Pfeiffer F, Weitkamp T, Bunk O, David C. Phase retrieval and differential phase-contrast imaging with low-brilliance X-ray sources. Nat Phys. 2006;2(4):258–261. [Google Scholar]
- 4.Pfeiffer F, et al. High-resolution brain tumor visualization using three-dimensional x-ray phase contrast tomography. Phys Med Biol. 2007;52(23):6923–6930. doi: 10.1088/0031-9155/52/23/010. [DOI] [PubMed] [Google Scholar]
- 5.Pfeiffer F, et al. Hard-X-ray dark-field imaging using a grating interferometer. Nat Mater. 2008;7(2):134–137. doi: 10.1038/nmat2096. [DOI] [PubMed] [Google Scholar]
- 6.Momose A, Yashiro W, Takeda Y, Suzuki Y, Hattori T. Phase tomography by X-ray Talbot interferometry for biological imaging. Jpn J Appl Phys. 2006;45(6A):5254–5262. [Google Scholar]
- 7.David C, et al. Hard X-ray phase imaging and tomography using a grating interferometer. Spectrochim Acta B. 2007;62(6-7):626–630. [Google Scholar]
- 8.Momose A, Yashiro W, Maikusa H, Takeda Y. High-speed X-ray phase imaging and X-ray phase tomography with Talbot interferometer and white synchrotron radiation. Opt Express. 2009;17(15):12540–12545. doi: 10.1364/oe.17.012540. [DOI] [PubMed] [Google Scholar]
- 9.Zhu P, et al. Low-dose, simple, and fast grating-based X-ray phase-contrast imaging. Proc Natl Acad Sci USA. 2010;107(31):13576–13581. doi: 10.1073/pnas.1003198107. [DOI] [PMC free article] [PubMed] [Google Scholar]
- 10.Hoshino M, Uesugi K, Yagi N. Phase-contrast X-ray microtomography of mouse fetus. Biol Open. 2012;1(3):269–274. doi: 10.1242/bio.2012430. [DOI] [PMC free article] [PubMed] [Google Scholar]
- 11.Zanette I, et al. Trimodal low-dose X-ray tomography. Proc Natl Acad Sci USA. 2012;109(26):10199–10204. doi: 10.1073/pnas.1117861109. [DOI] [PMC free article] [PubMed] [Google Scholar]
- 12.Pinzer BR, et al. Imaging brain amyloid deposition using grating-based differential phase contrast tomography. Neuroimage. 2012;61(4):1336–1346. doi: 10.1016/j.neuroimage.2012.03.029. [DOI] [PubMed] [Google Scholar]
- 13.Sun J, et al. Preliminary comparison of grating-based and in-line phase contrast X-ray imaging with synchrotron radiation for mouse kidney at TOMCAT. J Instrumentation. 2013;8(6):C06003. [Google Scholar]
- 14.Huang Z, Ruth RD. Laser-electron storage ring. Phys Rev Lett. 1998;80(5):976–979. [Google Scholar]
- 15.Bech M, et al. Hard X-ray phase-contrast imaging with the Compact Light Source based on inverse Compton X-rays. J Synchrotron Radiat. 2009;16(Pt 1):43–47. doi: 10.1107/S090904950803464X. [DOI] [PMC free article] [PubMed] [Google Scholar]
- 16.Bech M, et al. Experimental validation of image contrast correlation between ultra-small-angle X-ray scattering and grating-based dark-field imaging using a laser-driven compact X-ray source. Photonics & Lasers in Medicine. 2012;1(1):47–50. [Google Scholar]
- 17.Schleede S, et al. Multimodal hard X-ray imaging of a mammography phantom at a compact synchrotron light source. J Synchrotron Radiat. 2012;19(Pt 4):525–529. doi: 10.1107/S0909049512017682. [DOI] [PMC free article] [PubMed] [Google Scholar]
- 18.Schleede S, et al. Emphysema diagnosis using X-ray dark-field imaging at a laser-driven compact synchrotron light source. Proc Natl Acad Sci USA. 2012;109(44):17880–17885. doi: 10.1073/pnas.1206684109. [DOI] [PMC free article] [PubMed] [Google Scholar]
- 19.Achterhold K, et al. Monochromatic computed tomography with a compact laser-driven X-ray source. Nat Sci Rep. 2013;3:1313. doi: 10.1038/srep01313. [DOI] [PMC free article] [PubMed] [Google Scholar]
- 20.Hahn D, Thibault P, Noel P, Bech M, Pfeiffer F. A bone artifact reduction algorithm for differential phase-contrast CT based on statistical iterative reconstruction. Med Phys. 2012;39(6):3987. [Google Scholar]
- 21.Lee J-E, et al. H3K4 mono- and di-methyltransferase MLL4 is required for enhancer activation during cell differentiation. eLife. 2013;2:e01503. doi: 10.7554/eLife.01503. [DOI] [PMC free article] [PubMed] [Google Scholar]
- 22.Zhou H, et al. TAF7L modulated brown adipose tissue formation. eLife. 2014;3:e02811. doi: 10.7554/eLife.02811. [DOI] [PMC free article] [PubMed] [Google Scholar]
- 23.Herzen J, et al. Quantitative phase-contrast tomography of a liquid phantom using a conventional x-ray tube source. Opt Express. 2009;17(12):10010–10018. doi: 10.1364/oe.17.010010. [DOI] [PubMed] [Google Scholar]
- 24.Tapfer A, et al. Experimental results from a preclinical X-ray phase-contrast CT scanner. Proc Natl Acad Sci USA. 2012;109(39):15691–15696. doi: 10.1073/pnas.1207503109. [DOI] [PMC free article] [PubMed] [Google Scholar]
- 25.Nielsen MS, et al. X-ray tomography using the full complex index of refraction. Phys Med Biol. 2012;57(19):5971–5979. doi: 10.1088/0031-9155/57/19/5971. [DOI] [PubMed] [Google Scholar]
- 26.Rodt T, et al. Phantom and cadaver measurements of dose and dose distribution in micro-CT of the chest in mice. Acta Radiol. 2011;52(1):75–80. doi: 10.1258/ar.2010.100059. [DOI] [PubMed] [Google Scholar]
- 27.Figueroa SD, Winkelmann CT, Miller HW, Volkert WA, Hoffman TJ. TLD assessment of mouse dosimetry during microCT imaging. Med Phys. 2008;35(9):3866–3874. doi: 10.1118/1.2959847. [DOI] [PMC free article] [PubMed] [Google Scholar]
- 28.Loewen R. 2003. A Compact Light Source: Design and Technical Feasibility Study of a Laser-Electron Storage Ring X-ray Source. SLAC-Report 632 (Stanford University, Stanford, CA)
- 29.Weitkamp T, David C, Kottler C, Bunk O, Pfeiffer F. Tomography with grating interferometers at low-brilliance sources. Proc SPIE. 2006;6318:63180S. [Google Scholar]
Associated Data
This section collects any data citations, data availability statements, or supplementary materials included in this article.


