Fig. 1.
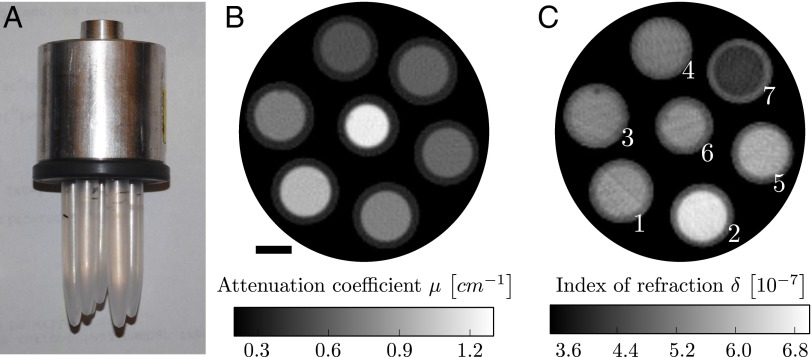
(A) Photograph of the fluid phantom. It consists of seven polyethylene rods containing seven different, chemically well-defined fluids (Table S1). (B and C) Average of 10 reconstructed slices of the linear attenuation coefficient μ (B) and the refractive index decrement δ (C). Fluids with similar attenuation coefficient show strong contrast in the phase image and vice versa. (Scale bar, 3 mm.) The white numbers in C correspond to the fluid sample number used in Table 1 and Table S1.

