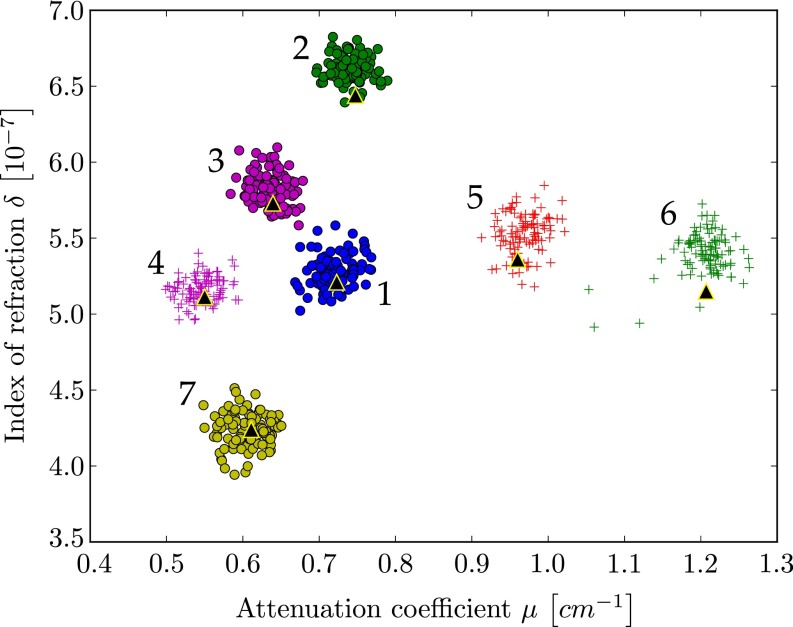
Fig. 2.
Scatter plot displays the attenuation coefficient and refractive index decrement for all pixels in the ROIs in the fluid phantom reconstructions (compare Fig. 1 B and C). Black triangles are the calculated values. Most substances show an overlap in either attenuation or phase signal alone, but all substances can clearly be distinguished using the combined information from both attenuation and phase. The different data clusters are labeled by numbers as used in Table 1 and Table S1.

