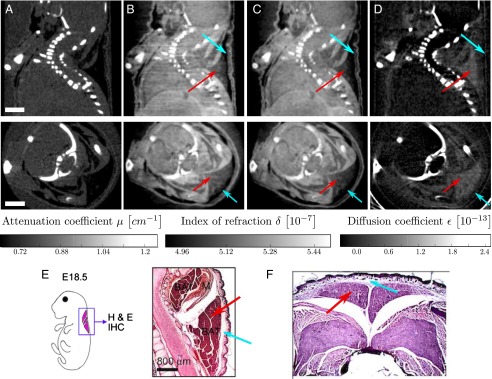
Fig. 4.

Reconstructed slices of a grating-based, multimodal CT scan of a biological sample (a formalin fixated infant mouse), in analogy to Fig. 3. Shown are sagittal (Top Row) and axial (Bottom Row) slices. The images show that brown adipose tissue is visible and can be discriminated from white adipose tissue in phase contrast (B and C) and dark-field contrast (D), but not in absorption contrast (A). (Scale bar, 2 mm.) Histological slices presented in E and F support this claim. E shows a sagittal section of the cervical/thoracic area stained with H&E of a mouse embryo (adapted from ref. 21). F shows an axial section of the interscapular area stained with H&E of a mouse embryo (adapted from ref. 22). Red arrows indicate brown adipose tissue; blue arrows indicate white adipose tissue.
