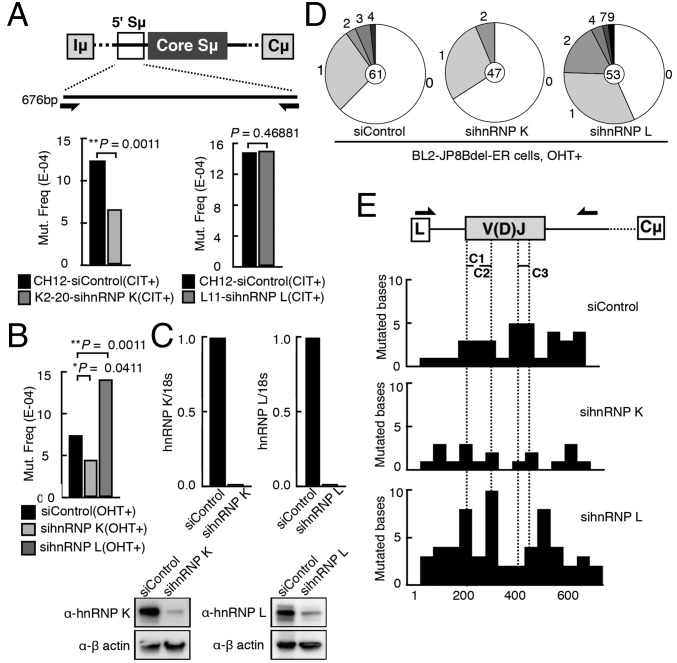
Fig. 2.
Depletion of hnRNP K, but not of hnRNP L, impairs the generation of mutations in the S and V regions. (A) Sequenced region of 5′ Sµ and the total mutational frequency in the K2-20 and L11 clones treated with siRNAs targeting hnRNP K and L, respectively. (B) Mutation analysis of the V region (V4-39/JH5) in BL2-JP8Bdel-ER cells treated with the indicated siRNAs. (C, Upper) qRT-PCR of hnRNP K and hnRNP L mRNA expression in the BL2-JP8Bdel-ER knockdown cells. (Lower) Corresponding Western blot analysis. (D) Pie charts depicting the proportion of clones that contained the indicated number of mutations. The total number of clones sequenced is indicated at the center. (E) Diagram representing the rearranged IgH V region. Primers used for sequencing the region are indicated above the scheme (arrows). The distribution of mutations is represented as the percentage of mutated bases per 50 bp sequenced. C1, CDR1; C2, CDR2; C3, CDR3; L, leader.

