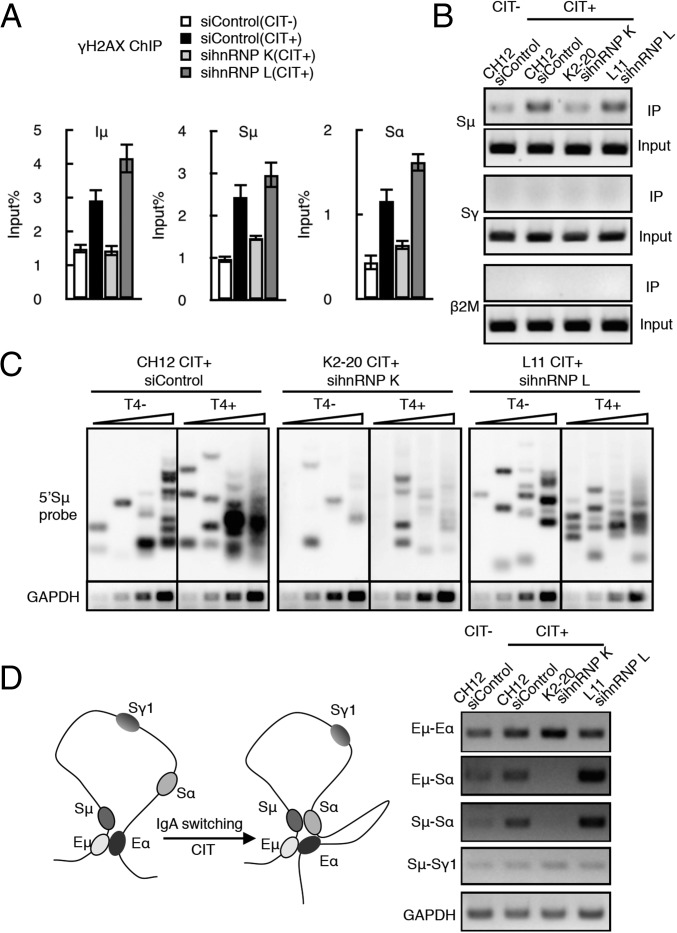
Fig. 3.
AID-induced DNA breakage is dependent on hnRNP K but not on hnRNP L. (A) DNA DSB determination by γH2AX ChIP assay using hnRNP K- or L-depleted CH12F3-2A cells. The presence or absence of CIT stimulation is indicated by (+) or (−), respectively. SD values were derived from three independent experiments. (B) Biotin-dUTP–labeled DNA break assay. PCR analysis of the S regions (Sμ and Sγ) and β2 microglobulin (β2M, control) in the K2-20 and L11 lines transfected with the indicated siRNAs. (C) LM-PCR–based DNA break assay using T4 polymerase-treated (T4+) and -untreated (T4−) DNA samples. A Southern blot analysis using an Sμ probe and the semiquantitative PCR analysis of GAPDH mRNA expression (control) are shown. DNA template samples were analyzed at threefold increasing DNA concentrations. (D, Left) Schematic view of the long-range interactions occurring at the IgH locus during CIT-induced IgA switching in CH12F3-2A cells, which brings Sμ and Sα into close proximity. (Right) 3C PCR analysis is shown under four different conditions, as indicated. Each PCR panel represents a pair of long-range interactions at the IgH locus (indicated at left). GAPDH PCR analysis of the cross-linked DNA sample served as a loading control.

