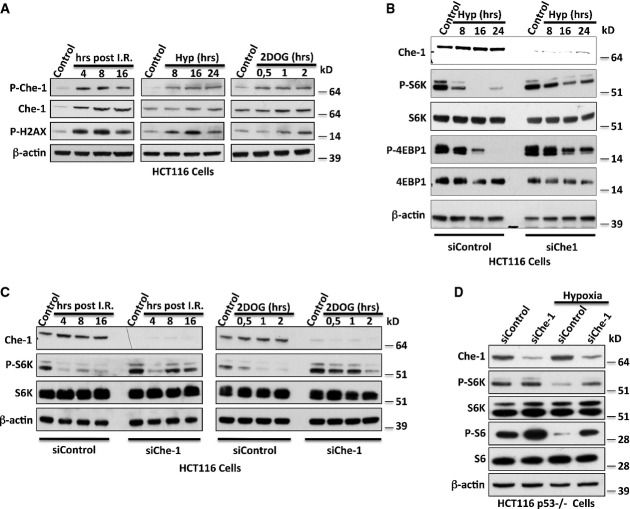
Figure 2. Che-1 regulates mTOR activity in response to cellular stress.
- A WB analysis with the indicated Abs of TCEs from HCT116 treated with I.R. (20 Gy) (left), hypoxia (1% O2) (center), or 2DOG (25 mM) (right).
- B, C WB analysis with the indicated Abs of TCEs from HCT116 cells with siRNA GFP (siControl) or siRNA Che-1 (siChe-1) and treated with hypoxia (B), I.R. (C, left), or 2DOG (C, right).
- D WB analysis of TCEs from HCT116 p53−/− cells treated or not with hypoxia (1% O2) for 16 h.
Source data are available online for this figure.

