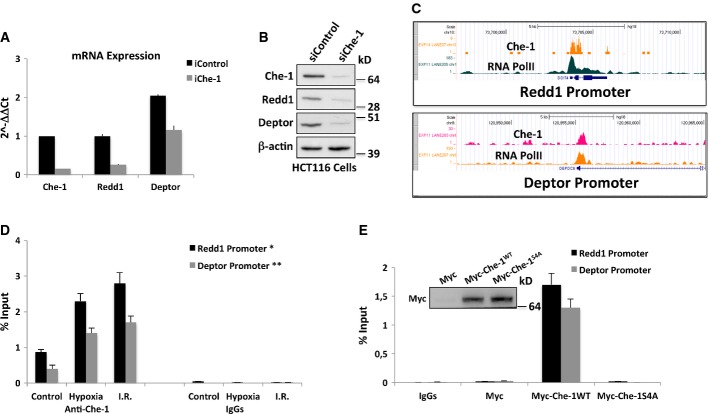
Figure 3. Che-1 induces Redd1 and Deptor expressions.
- Quantitative RT–PCR (qRT–PCR) for the indicated genes was performed after transient transfection of HCT116 cells with siRNA GFP (siControl) or siRNA Che-1 (siChe-1). Values were normalized to RPL19 expression. Error bars represent the standard error of three different experiments. P < 0.03
- WB analysis with the indicated Abs of TCEs from HCT116 cells transiently transfected as in (A).
- Genome browser snapshot of Che-1 and phospho-S5 RNA polymerase II ChIP-seq depicting the Redd1 (upper panel) and Deptor (lower panel) promoter regions.
- HCT116 cells treated with hypoxia (1% O2 for 4 h) or I.R. (20 Gy) were subjected to quantitative ChIP analysis (ChIP-qPCR) using anti-Che-1 antibody or control rabbit IgGs. Data are expressed as percent of input. Error bars represent the standard error of three different experiments. *P ≤ 0.001, **P = 0.01.
- HCT116 cells were transiently transfected with pCS2-MT control vector, Myc-Che-1 wild-type, or Myc-Che-1S4A expression vectors and treated with hypoxia (1% O2 for 16 h). Then, cells were subjected to ChIP-qPCR using anti-Myc Ab or control IgGs. Error bars represent the standard error of three different experiments.

