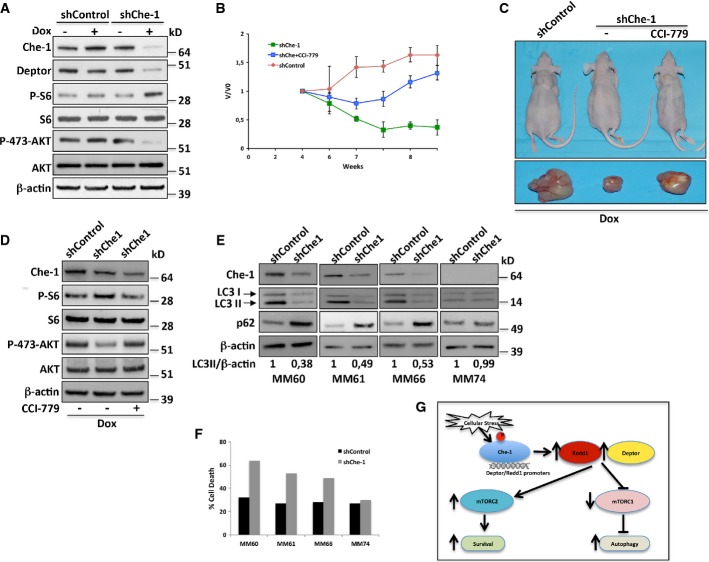
Figure 8. Che-1 depletion suppresses multiple myeloma growth in vivo.
- A Kms27 cells were infected with LV-THsh/Che-1 (shChe-1) or LV-THsh/Control (shControl) and LV-tTR-KRAB lentiviruses and TCEs from cells induced (+Dox) or not (−Dox) were analyzed by WB with the indicated Abs.
- B–D (B) Engineered Kms27 ind-shChe-1 and Kms27 ind-shControl cell lines were implanted subcutaneously into nu/nu mice, and animals were treated as reported (see text). Animals were weekly monitored as reported in Materials and Methods. Relative tumor growth was estimated by the formula V/V0, where V represents tumor volume at different times post-treatment, whereas V0 represents tumor volume before treatment. The graphic is representative of two independent experiments with similar results. (C) Representative mice (top) or excised tumors (bottom) from induced (+Dox) Kms27 ind-shChe-1 and Kms27 ind-shControl implanted cells treated or not with CCI-779. (D) Western blot analysis of excised tumors performed by using the indicated Abs.
- E, F CD138+ neoplastic cells from patients with symptomatic myeloma were cocultured with stromal cells from the same patient for 24 h before infecting them with shChe-1 or shControl lentiviral vectors. After 96 h, TCEs from MM primary cells transfected with siControl or siChe-1 were analyzed by WB with the indicated Abs (E), and the relative number of viable myeloma cells was quantified by FACS (F).
- G Model to explain Che-1 involvement in the control of mTOR activity. In response to cellular stress, Che-1 is activated and recruited onto Redd1 and Deptor promoters inducing their expression. This results in a simultaneous decrease of mTORC1 activity and increase of mTORC2 activity, allowing induction of autophagy and survival.
Source data are available online for this figure.

