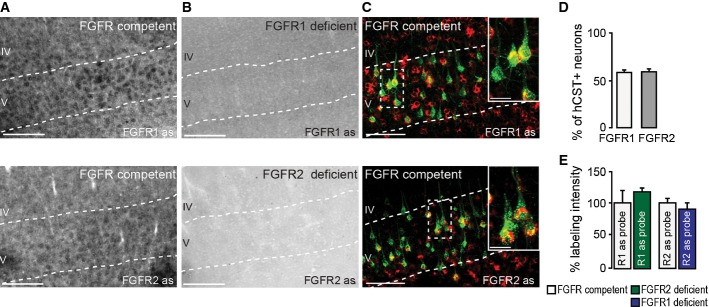
Figure 3. FGFR1 and FGFR2 are expressed in adult cortical projection neurons.

- In situ hybridization of FGFR1 (top) and FGFR2 (bottom) mRNA in FGFR-competent mice. Scale bar equals 200 μm.
- In situ hybridization of FGFR1 (top) and FGFR2 (bottom) mRNA in forebrain FGFR1 (top)- and FGFR2 (bottom)-deficient mice. Scale bar equals 200 μm.
- Retrograde labeling of CST projection neurons with dextran conjugated with Texas Red® (green) shows that many of these neurons express FGFR1 (red, top) and FGFR2 mRNA (red, bottom; insets in top and bottom panels are twofold magnification of boxed areas). Scale bar equals 100 μm (20 μm in insets).
- Quantification of the percentage of CST projection neurons in layer V of the cortex expressing FGFR1 (white bar) and FGFR2 mRNA (gray bar; n = 5 animals per group). Mean ± SEM.
- Quantification of the intensity of the in situ signal for FGFR1 mRNA in FGFR2-deficient mice (green bar) and FGFR2 mRNA in FGFR1-deficient mice (blue bar) normalized to the signal intensity measured in the respective FGFR-competent control group (white bars; n = 3 animals per group). Mean ± SEM. No significant differences between the groups were detected (unpaired two-tailed t-tests).
