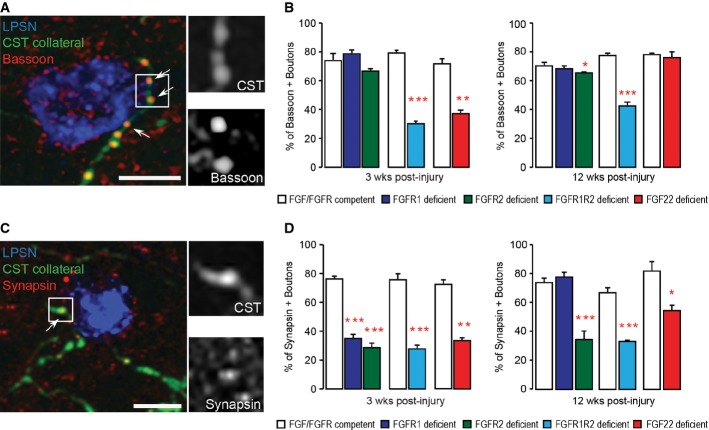
Confocal image of synaptic contacts (arrows) between a CST collateral (green) and a LPSN (blue) that show bassoon immunoreactivity (red). Right images are magnification (two and a half-fold) of the area boxed on the left. Scale bar equals 25 μm.
Quantification of the percentage of boutons on cervical hindlimb CST collaterals that are immunoreactive for bassoon at 3 weeks (left) and 12 weeks (right) after spinal cord injury in FGF22-deficient, forebrain FGFR1-deficient, forebrain FGFR2-deficient and hindlimb motor cortex FGFR1/FGFR2 double-deficient mice compared to the respective FGF22- and FGFR-competent control mice. A minimum of 100 boutons per mouse were evaluated for 3 mice per group. ***P < 0.0001 FGFR-competent versus FGFR1/FGFR2 double-deficient mice at 3 weeks (unpaired two-tailed t-tests), **P = 0.002 FGF-competent versus FGF22 deficient at 3 weeks (unpaired two-tailed t-tests), *P < 0.05 FGFR-competent versus FGFR2 single-deficient mice at 12 weeks (one-way ANOVA followed by Tukey tests), ***P = 0.001 FGFR-competent versus FGFR1/FGFR2 double-deficient mice at 12 weeks (unpaired two-tailed t-tests).
Confocal image of synaptic contacts (arrows) between a CST collateral (green) and a LPSN (blue) that show synapsin I immunoreactivity (red). Right images are magnification (two and a half-fold) of the area boxed on the left. Scale bar equals 25 μm.
Quantification of the percentage of boutons on cervical hindlimb CST collaterals that are immunoreactive for synapsin I at 3 weeks (left) and 12 weeks (right) after spinal cord injury in FGF22-deficient, forebrain FGFR1-deficient, forebrain FGFR2-deficient and hindlimb motor cortex FGFR1/FGFR2 double-deficient mice compared to the respective FGF22 and FGFR-competent control mice. A minimum of 100 boutons per mouse were evaluated for 3 mice per group. ***P < 0.001 FGFR-competent versus FGFR1 and FGFR2 single-deficient mice at 3 weeks (one-way ANOVA followed by Tukey tests). ***P = 0.0001 FGFR-competent mice versus FGFR1/FGFR2 double-deficient mice at 3 weeks (unpaired two-tailed t-tests), P = 0.00004 FGF-competent mice versus FGF22-deficient mice at 3 weeks (unpaired two-tailed t-tests). ***P < 0.001 FGFR-competent versus FGFR2 single-deficient mice (one-way ANOVA followed by Tukey tests). ***P = 0.0006 FGFR-competent mice versus FGFR1/FGFR2 double-deficient mice at 12 weeks (unpaired two-tailed t-tests), *P = 0.027 FGF-competent mice versus FGF22-deficient mice at 12 weeks (unpaired two-tailed t-tests).

