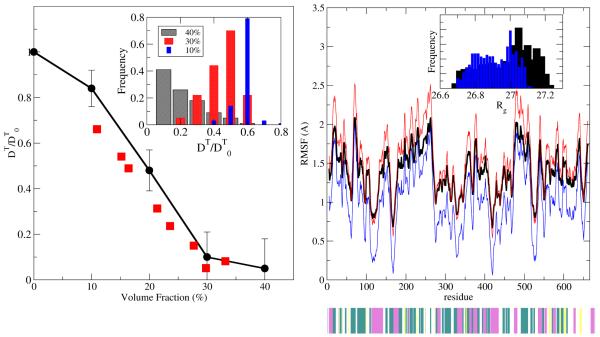
Fig.7.
MUPHY/OPEP results. Left: Translational diffusion coefficients at various volume fractions (black circles) are compared to the experimental data of bovine serum albumin246 (red squares). The diffusion coefficient is normalized by the value at virtually zero volume fraction, and the solid line is a guide to the eye. Inset: Histogram of diffusivity stemming from the ensemble of proteins. Right: RMS fluctuations from the crystallographic structure at 40% volume fraction (black curve). Structures with maximal (red) and minimal (blue) departures from the average value are shown. Secondary structure is indicated as a lower bar with colour green (turn), yellow (β-strand), magenta (α-helix) and white (coil). Inset: Histogram of Rg values.

