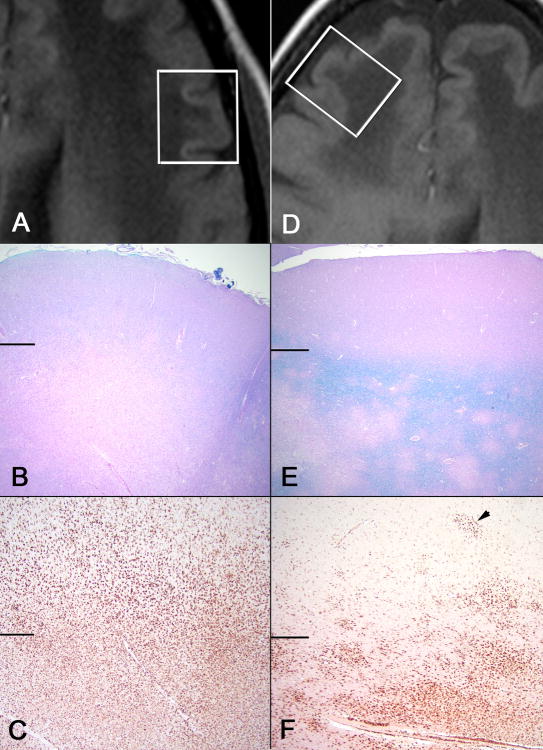
Figure 2. Pathologic findings in a PML-IRIS patient with multiple sclerosis treated with natalizumab.
Area of HCS (A, B, C) compared to isointense cortex (D, E, F) in the same patient. (A) T1-weighted image demonstrating hyperintense cortical signal adjacent to a PML lesion, and (D) isointense cortex on T1-weighted image adjacent to a PML lesion. White boxes represent histologic sampling. Horizontal lines in B, C, E, F separate cortex (above) from white matter (below) (B) Myelin stain in HCS area demonstrates a near complete demyelination in white matter and loss of demarcation of gray-white junction, while isointense area (E) shows patchy demyelination with an intact rim of myelin at the gray-white junction (B and E, LFB-H&E 20x). (C) CD68 stain highlights prominent infiltration of macrophages in white matter extending deep into cortex in HCS area; while the isointense area shows prominent CD68 staining mostly limited to the white matter (F) with only scattered macrophages and microglial nodules (arrow head) involving deep cortical layers (C and F, CD68 40x)

