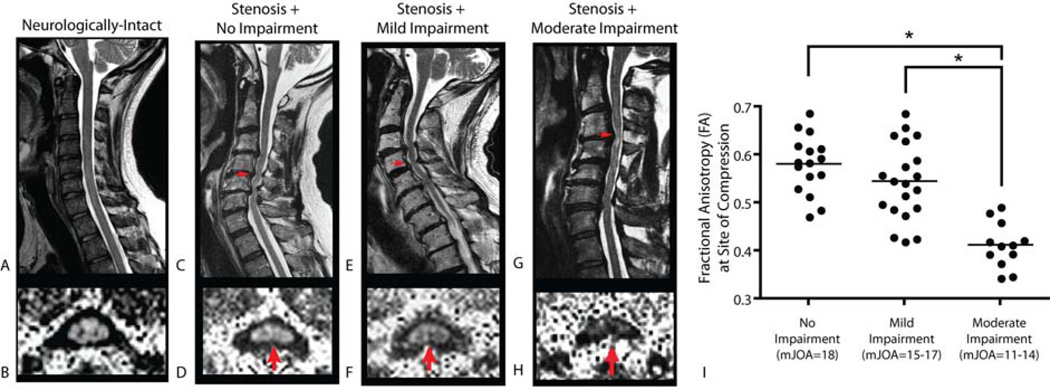
Figure 2. Fractional Anisotropy at the Site of Spinal Cord Compression.
Sagittal T2-weighted images (A,C, E, G) and fractional anisotropy (FA) images (B,D,F,H) of a neurologically-intact control subject (A,B), showing high FA in spinal cord white matter (B), a patient with cervical spondylosis without neurological impairment (C,D; mJOA=18), a patient with cervical spondylosis with mild impairment (E,F; mJOA=15), and a patient with cervical spondylosis with moderate impairment (G,H; mJOA=12). Note patients demonstrate a decreasing FA at the site of most severe compression with increasing neurological impairment, suggestive of increasing microstructural damage. Note on axial images posterior = top, anterior = bottom. I) Comparison of FA at the site of compression between patients without neurological impairment (mJOA=18), patients with mild impairment (mJOA=15–17), and patients with moderate impairment (mJOA=10–14). Results show a significant difference between patients with moderate impairment and those with mild or no impairment (ANOVA, P<0.0001; Tukey’s test, P<0.05 for moderate vs. mild or no impairment). * = P < 0.05.

