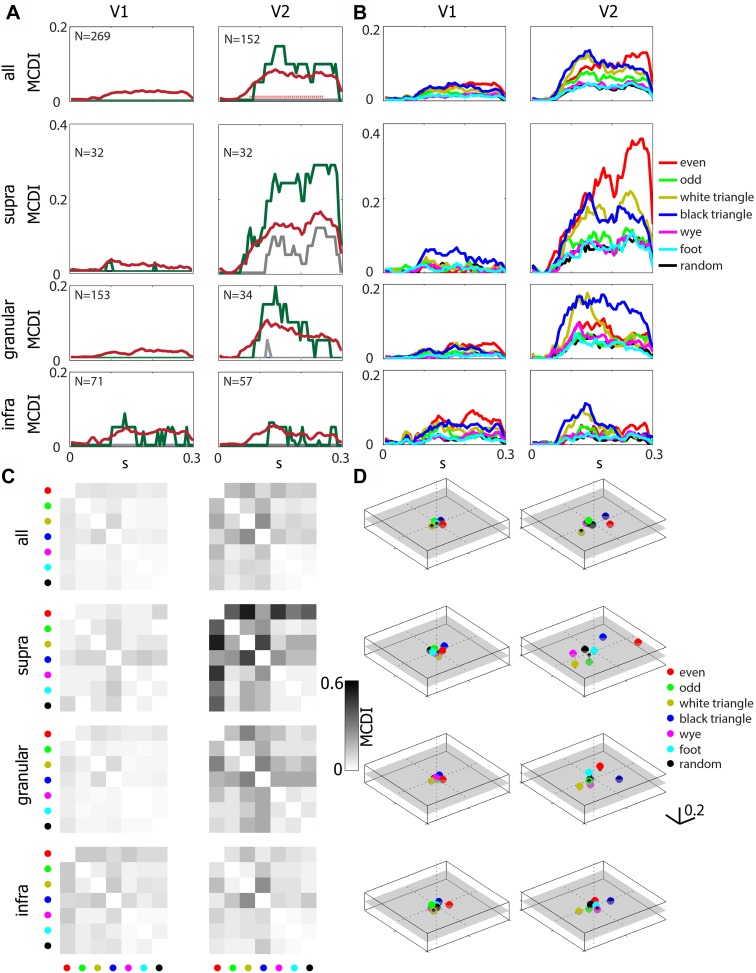
Figure 2. Differential sensitivity to multipoint correlations arises intracortically, primarily in V2, and are selective for informative (Tkačik et al., 2010) multipoint correlations.
(A) The multipoint correlation discrimination index (MCDI, see ‘Materials and methods’) for all stimulus types. Upper panels include all neurons in each area, lower three rows subdivide according to lamina. Mean (dark red), median (gray), and 75th percentile (dark green). 25th percentile is 0 in all cases. The red dots in the upper right panel indicate a significant difference between V2 and V1 (p < 0.05, two-tailed, Wilcoxon rank-sum test, false-discovery-rate corrected). The number in the upper left of each panel indicates the number of units analyzed. (B) Mean values of the stimulus-specific MCDI. The stimuli with the highest contributions are the ones that contain correlations that are informative for natural images (Tkačik et al., 2010): even (red), odd (green), white triangles (yellow) black triangles (blue). In contrast, the others (random (black), wye (magenta), and foot (cyan)) are uninformative for natural images, and contributed little to the MCDI. (C) Pairwise discrimination of the multipoint correlation types. The grayscale shows the average pair-specific MCDI, which is the fraction of neurons that respond differentially at any time from 55 to 250 ms following stimulus onset. The stimuli for each row and column are indicated by the same color code as in panel B. Note that panel A shows the overall MCDI, panel B shows the stimulus-specific MCDI, and panel C shows the pair-specific MCDI. (D) Multidimensional scaling of the pair-specific MCDI. The distance between two points corresponds to the fraction of neurons that responds differentially to each type of multipoint correlation. A semitransparent gray plane marks the 0-value along the vertical. Note that in V2, especially in the supragranular layer, there is a wide separation between even and odd stimuli, and between black and white triangle stimuli, and these separations lie on different axes.


