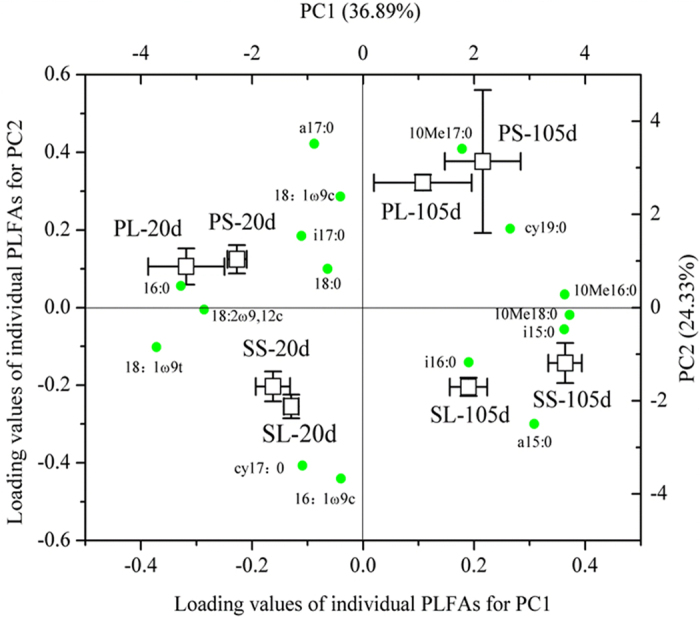
Figure 5.

Principal components analysis (PCA) of 13C distribution among phospholipid fatty acids (PLFAs) (relative 13C incorporation into each individual PLFA (%)) as affected by fresh organic matter (FOM) treatments at 20 d and 105 d of the incubation. Both score plot of treatments and loading values of individual PLFAs are shown. PL, Larch Plantation soil+leaves; PS, Larch Plantation soil+stalks; SL, Secondary Forest soil+leaves; SS, Secondary Forest soil+stalks.
