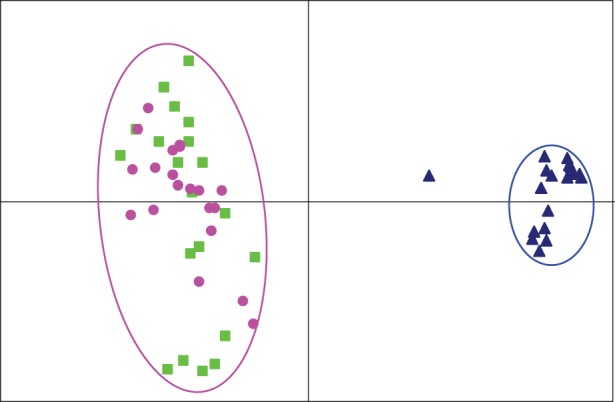
Figure 4.

Plots from Pcagen analyses of LG2 in Ammarnäs, with phased male haplotypes. The Y haplotypes (blue triangles) cluster on their own, while the male X haplotypes (green squares) co-localize with the female genotypes (pink dots). The Y outlier is A17M.
