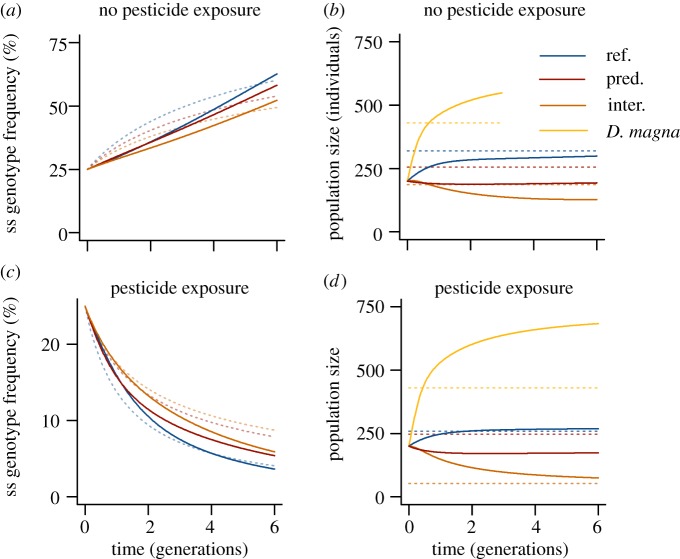
Figure 3.
Simulation of the microevolutionary effects of predation and interspecific competition. The growth parameters of the extended Lotka–Volterra model were fitted to our experimental conditions (see electronic supplementary materials). Non-selective predation (pred.) and interspecific competition (inter.) delay the increase of susceptible (ss) individuals under non-toxic conditions (a) and the selection against ss individuals under toxic conditions (c). For comparison, the dotted lines represent the average change of the ss genotype frequencies measured in the experiment. (b,d) The simulated population sizes of the mosquitoes and of the interspecific competitor (D. magna). For comparison, the dotted lines represent the average population sizes over time measured in the experiment. See the electronic supplementary material, table S5 for the parameter values.

