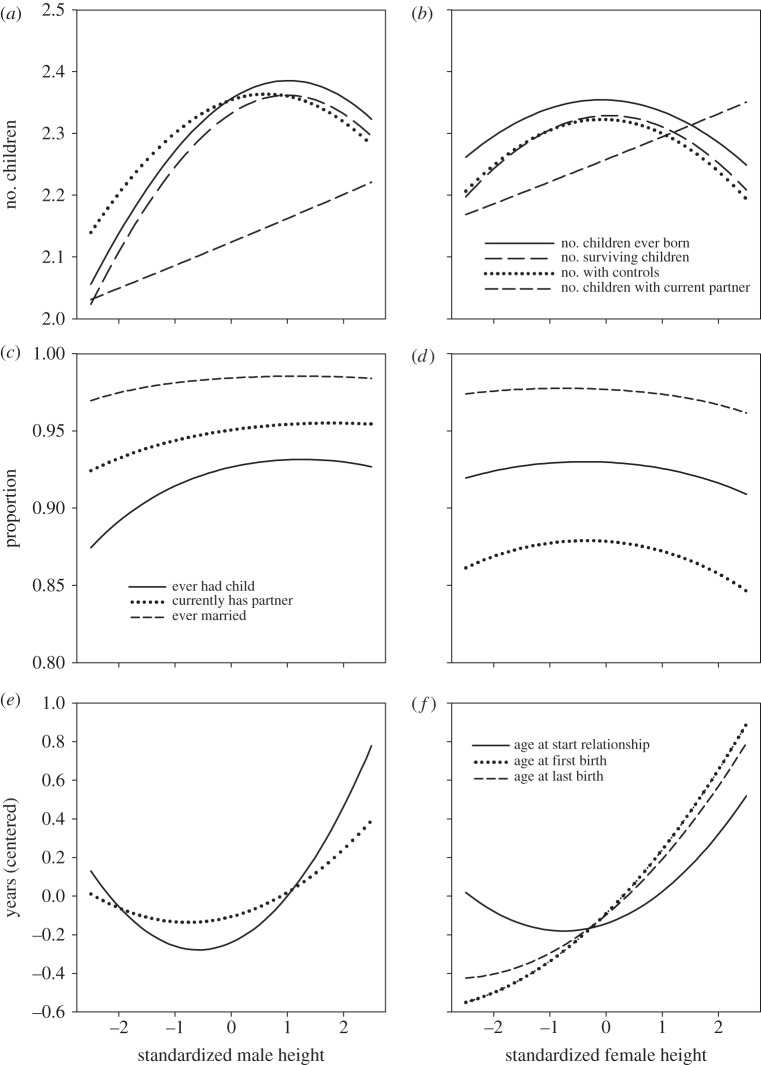
Figure 1.
Model predictions for the effect of (a,c,e) male and (b,d,f) female height (standardized) on several variables. The height range between −2.5 and 2.5 standard deviations is plotted. Models evaluated for birth cohort 1950–1954. The number of children with current partner (c and d) is evaluated at the median age at the start of the relationship. Health, education and income are control variables in a and b.

