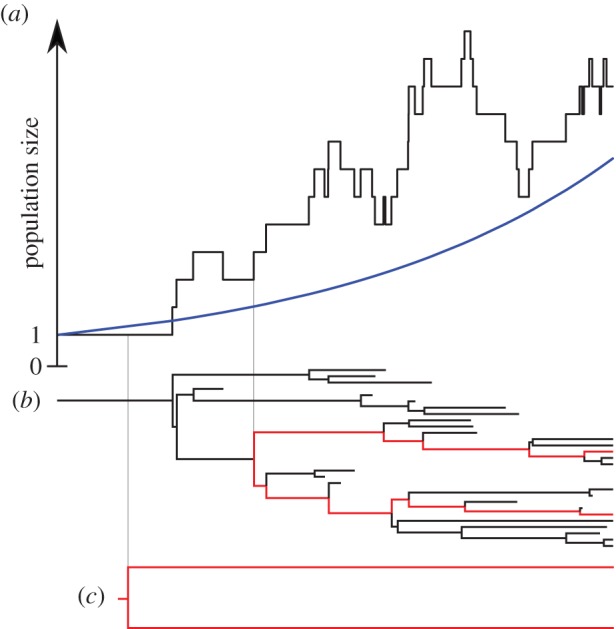
Figure 1.

(a) Birth–death population size trajectory (black line) and corresponding deterministic exponential growth (blue line) curve obtained with growth rate r = λ − μ. (b) Full corresponding birth–death tree (black) and a subtree (red) spanning two sampled lineages. (c) A representative and deterministic growth coalescent tree. Note that while coalescence time in the sampled birth–death tree corresponds precisely with a birth event in the population size trajectory, the same is not true for the deterministic coalescent tree.
