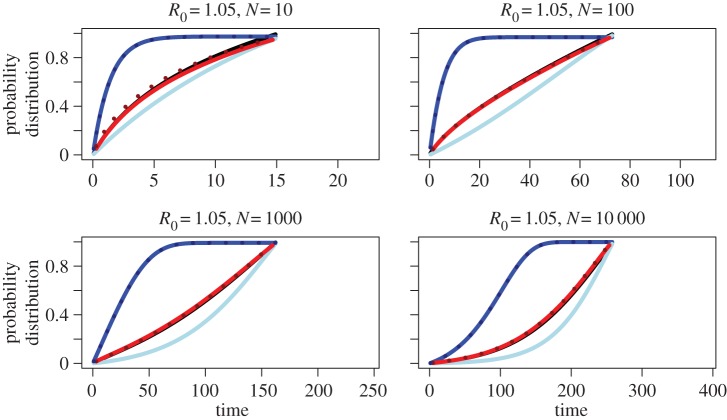
Figure 2.
Cumulative probability distribution function of time to coalescence of two lineages in our models, fBD(t), fCD(t), fCDN(t) and fCS(t), for low R0 = 1.05 and N = 10, 100, 1000 and 10 000. Black displays the distribution of coalescent times under the birth–death (BD) model, blue under the deterministic coalescent (CD; dotted line corresponds to coalescent rate proportional to 1/(N(t) − 1)), and red under the stochastic coalescent (CS; dotted line corresponds to coalescent rate proportional to 1/(N(t) − 1)). Light blue corresponds to the deterministic coalescent with population size being the expected BD population size (CDN).

