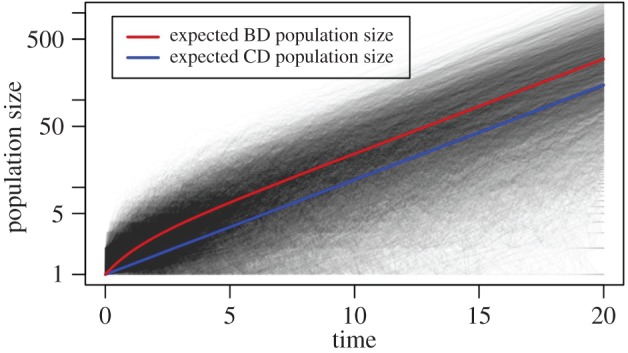
Figure 4.

Trajectories of the population size (on a log scale) through time under the birth–death model (black) together with their expected size conditional on survival of the epidemic (red). These trajectories are also the basis of the coalescent with stochastic population growth via birth–death trajectories. The population size under the coalescent with deterministic population size change follows the blue line (which has slope r = λ − μ).
