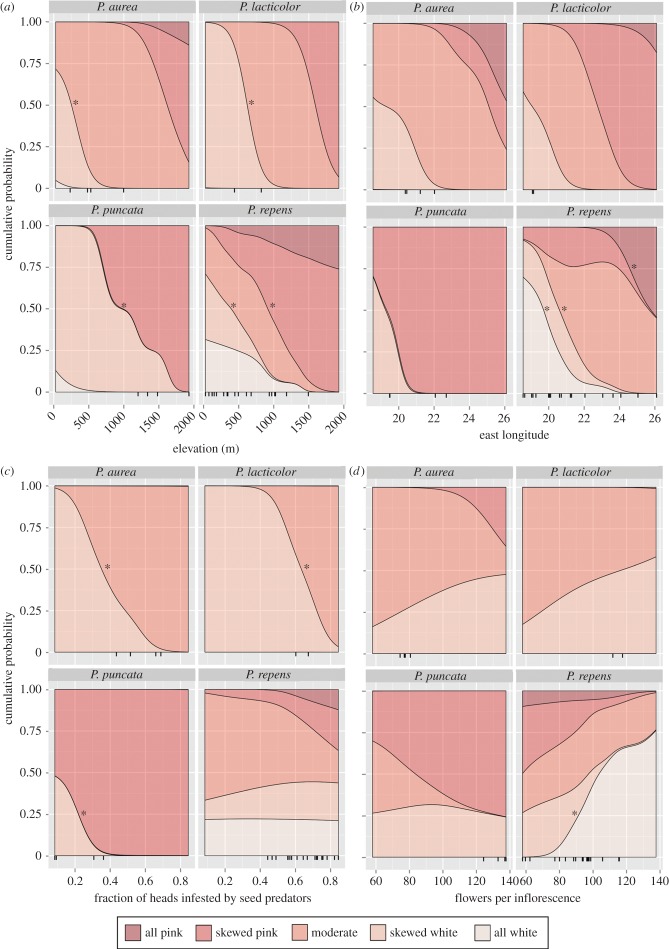
Figure 3.
The cumulative probability of each morph frequency class in four Protea species as it changes with (a) elevation, (b) east longitude, (c) fraction of seed heads infested with seed predators, and (d) the average number of flowers per inflorescence. Output is based on a path analysis with a separate slope for P. repens versus three Exsertae species and separate random intercepts for each species (see Material and methods). An asterisk represents a significant transition between all colour morph classes to the left of the asterisked line and the class to the right; asterisks for the three Exsertae species reflect a single significant result. Tick-marks underneath each subplot show the actual values for each population (n = 28). (Online version in colour.)

