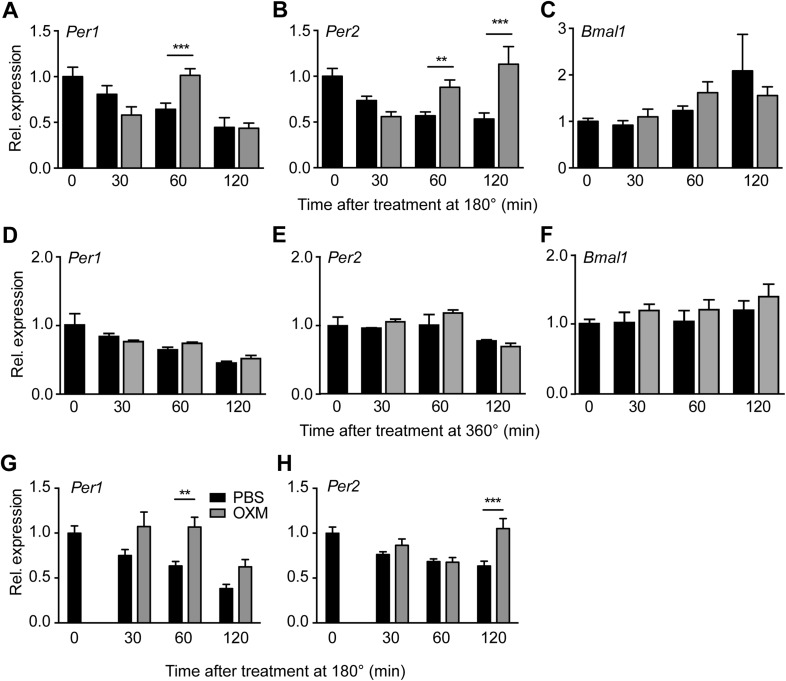
Figure 3. OXM treatment induces Per1/2 expression in organotypic liver slices.
(A–C) WT liver slices were treated with OXM (grey) or vehicle (PBS; black) at 180° and analyzed for clock gene expression of Per1 (A; factor treatment F(1, 40) = 0.785; time F(3, 40) = 34.95; interaction F(3, 40) = 16.33), Per2 (B; factor treatment F(1, 40) = 24.02; time F(3, 40) = 29.4; interaction F(3, 40) = 38.38), and Bmal1 (C; factor treatment F(1, 40) = 0.108; time F(3, 40) = 17.39; interaction F(3, 40) = 3.607) by qPCR. (D–F) WT liver slices were treated with OXM (grey) or PBS (black) at 360° and analyzed for expression of Per1 (D; factor treatment F(1, 40) = 1.179; time F(3, 40) = 36.33; interaction F(3, 40) = 1.349), Per2 (E; factor treatment F(1, 40) = 5.757; time F(3, 40) = 13.57; interaction F(3, 40) = 1.135), and Bmal1 (F; factor treatment F(1, 40) = 4.112; time F(3, 40) = 8.788; interaction F(3, 40) = 0.491) by qPCR. (G and H) OXM-induced Per1/2 expression is retained in Glp1r−/− liver slices. Per1: factor treatment F(1, 42) = 8.48; time F(2, 42) = 10.95; interaction F(2, 42) = 0.525. Per2: factor treatment F(1, 42) = 10.5; time F(2, 42) = 3.662; interaction F(2, 42) = 5.845. Glp1r−/− liver slices were treated as described for WT above. Data are presented as mean ± S.E.M. (n = 6 for WT and 8 for Glp1r−/−). Two-way ANOVA with Bonferroni post-test: **p < 0.01; ***p < 0.001.

