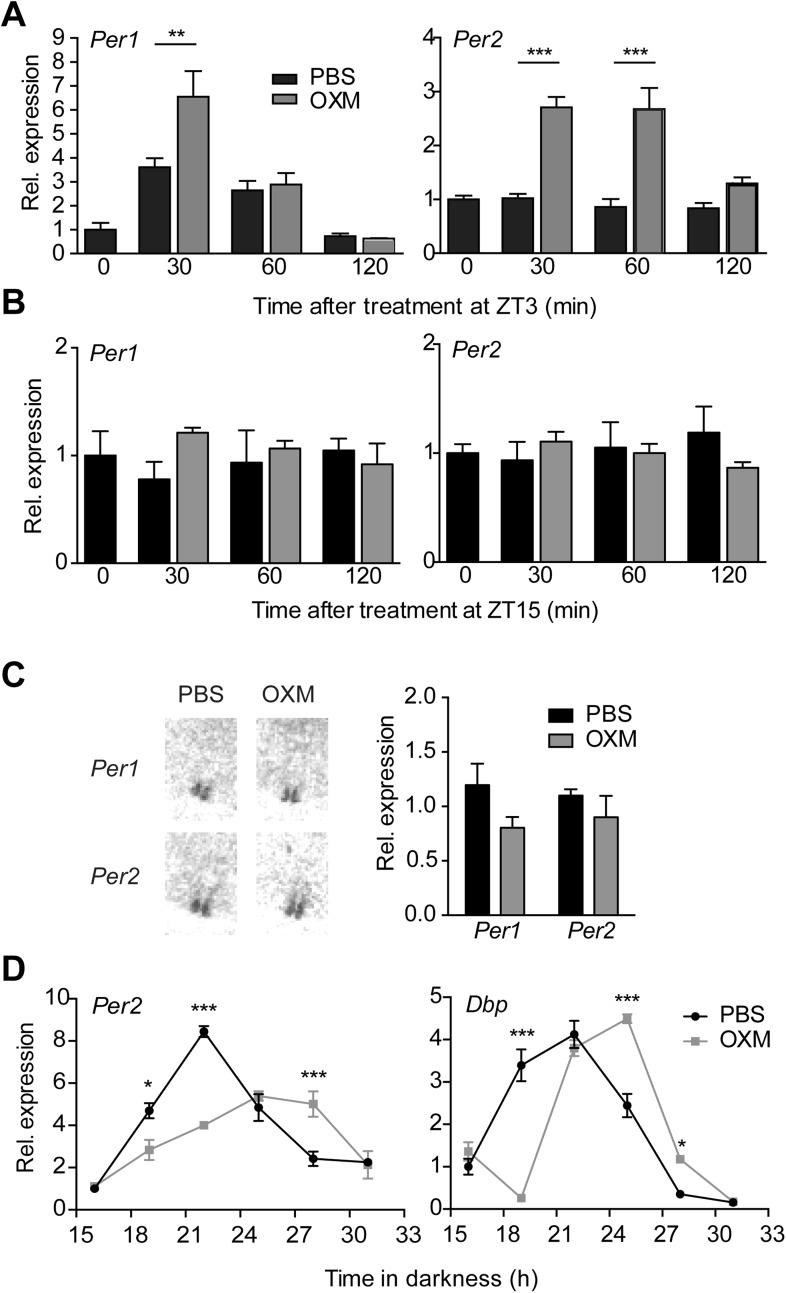
Figure 4. OXM treatment induces Per1/2 expression and resets the liver circadian clock in vivo.
(A and B) Hepatic Per gene expression after OXM (grey) or vehicle (PBS; black) i.v. injection at ZT3 (A) and ZT15 (B). ZT3: Per1: factor treatment F(1, 24) = 5.695; time F(2, 24) = 34.74; interaction F(2, 24) = 4.965; Per2: factor treatment F(1, 24) = 64.84; time F(2, 24) = 9.381; interaction F(2, 24) = 6.915. ZT15: Per1: factor treatment F(1, 12) = 1.096; time F(2, 12) = 0.005; interaction F(2, 12) = 1.367; Per2: factor treatment F(1, 24) = 0.255; time F(2, 24) = 0.001; interaction F(2, 24) = 1.172. (C) Suprachiasmatic nucleus (SCN) signal after in situ hybridization (ISH) of brain sections with 35S-labelled antisense probes for Per1/2 30 min after OXM/PBS treatment at ZT3 in the same animals used in (A). Left panel: representative autoradiograph scans containing the SCN; right panel: quantification of the ISH. (D) Resetting of Per2 and Dbp rhythms in livers of wild-type mice after an i.p. injection of either OXM (grey) or vehicle (PBS; black) after 12-hr darkness; Per2: factor treatment F(1, 24) = 5.531; time F(5, 24) = 46.37; interaction F(5, 24) = 18.71. Dbp: factor treatment F(1, 24) = 0.094; time F(5, 24) = 119.2; interaction F(5, 24) = 38.58. All data are presented as mean ± S.E.M. (n = 3–5). A, B, and D: two-way ANOVA with Bonferroni post-test: *p < 0.05, **p < 0.01; ***p < 0.001; C: Mann–Whitney test.

