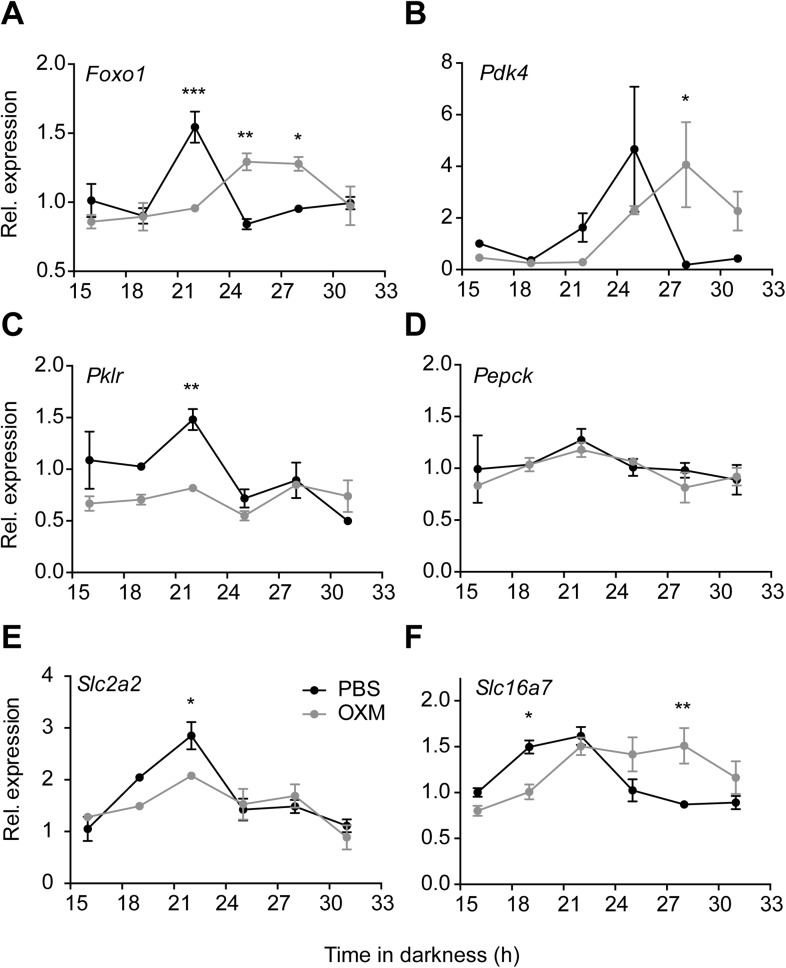
Figure 5. OXM treatment modulates diurnal expression profile of hepatic genes involved in liver carbohydrate metabolism.
(A–F) Relative gene expression of Foxo1 (A; factor treatment F(1, 24) = 0.001, time F(5, 24) = 5.547, interaction F(5, 24) = 11.13), Pdk4 (B; factor treatment F(1, 24) = 0.197, time F(5, 24) = 3.35, interaction F(5, 24) = 3.247), Pklr (C; factor treatment F(1, 24) = 11.63, time F(5, 24) = 5.61, interaction F(5, 24) = 3.61), Pepck (D; factor treatment F(1, 24) = 0.574, time F(5, 24) = 2.043, interaction F(5, 24) = 0.299), the glucose transporter Slc2a2 (E; factor treatment F(1, 24) = 2.582, time F(5, 24) = 15.98, interaction F(5, 24) = 2.642) and the pyruvate transporter Slc16a7 (F; factor treatment F(1, 24) = 1.539, time F(5, 24) = 7.472, interaction F(5, 24) = 6.586) after i.p. administration of either OXM (grey) or vehicle (PBS; black) after 12 hr in darkness. Data are presented as mean ± S.E.M. (n = 4). Two-way ANOVA with Bonferroni post-test: *p < 0.05, **p < 0.01; ***p < 0.001.

