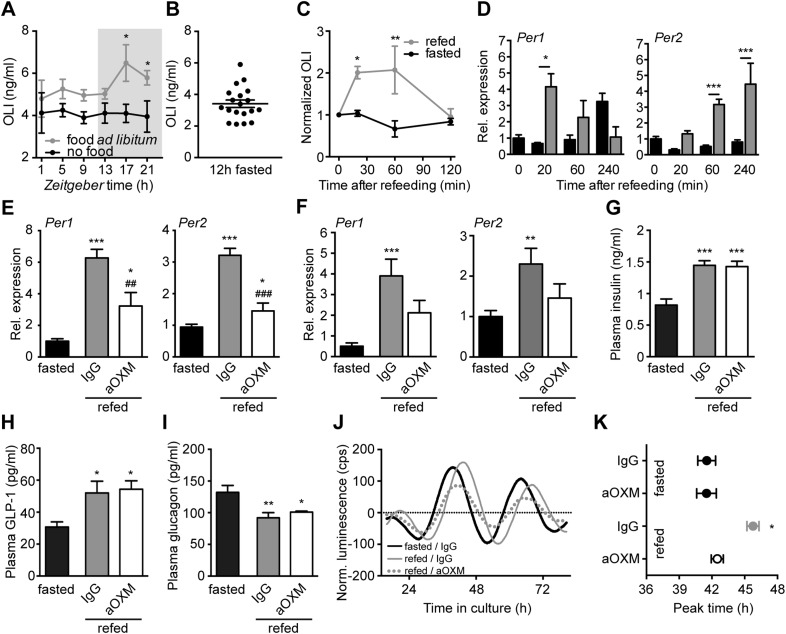
Figure 6. Endogenous OXM signaling regulates food intake-mediated resetting of the liver circadian clock.
(A) Plasma oxyntomodulin-like immunoreactivity (OLI) diurnal profiles under ad libitum food and fasting conditions. Data are presented as mean ± S.E.M (n = 6); factor time F(5, 60) = 0.628, feeding condition F(1, 60) = 15.37, interaction F(5, 60) = 0.638. Grey shading indicates the dark phase. (B) OLI levels show high individual variations in mice after 12 hr of food deprivation (ZT13-1). (C) Plasma OLI (normalized to individual fasting levels) after refeeding (grey line) or under continuous starving (black line); factor time F(3, 21) = 3.544, feeding condition F(1, 21) = 15.82, interaction F(3, 21) = 4.717. (D) Liver Per1/2 induction following fasting-refeeding determined by qPCR; Per1: factor time F(3, 25) = 0.454, feeding condition F(1, 25) = 1.376, interaction F(3, 25) = 4.453; Per2: factor time F(3, 25) = 6.938, feeding condition F(1, 25) = 38.48, interaction F(3, 25) = 3.767. (E) WT and (F) Glp1r−/− liver Per1/2 expression after fasting-refeeding with control IgG injection (grey) or OXM immuno-neutralization by anti-OXM IgG (aOXM) injection at ZT0; WT: Per1: F(2, 12) = 71.76, Per2: F(2, 12) = 47.41; Glp1r−/−: Per1 F(2, 12) = 11.51, Per2: F(2, 12) = 5.585. (G–I) Treatment with anti-OXM IgG does not affect postprandial regulation of insulin, GLP-1, and GCG. Plasma levels of insulin (G; F(2, 12) = 17.44), GLP-1 (H; F(2, 12) = 5.563), and GCG (I; F(2, 12) = 7.128) after fasting-refeeding with control IgG injection (grey) or OXM immuno-neutralization by anti-OXM IgG (aOXM) treatment at ZT0. One- (E–I) or two-way ANOVA (A, C, D) with Bonferroni post-test: *p < 0.05; **p < 0.01; ***p < 0.001 against fasted; ##p < 0.01; ###p < 0.001 against IgG. Data are presented as mean ± S.E.M (n = 5). (J and K) Liver PER2::LUC rhythms after fasting-refeeding with control IgG or αOXM administration. (J) Representative luminescence traces. (K) Comparison of phases (second peak in culture) after refeeding and/or anti-OXM treatment (Data are presented as mean ± S.E.M (n = 4 mice per condition, an average of 3 slice preparations of each mouse were used); two-way ANOVA with Bonferroni post-test: *p < 0.05 against fasted; factor treatment F(1, 12) = 5.127, feeding condition F(1, 12) = 13.02, interaction F(1, 12) = 5.044).
DOI: http://dx.doi.org/10.7554/eLife.06253.011


