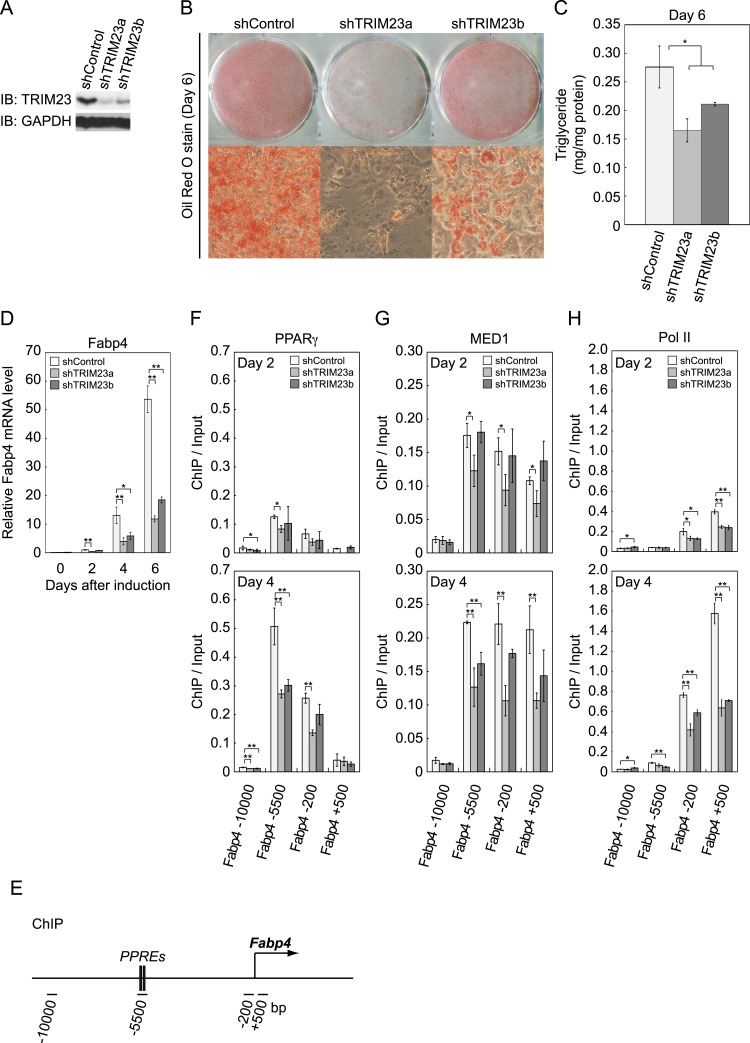
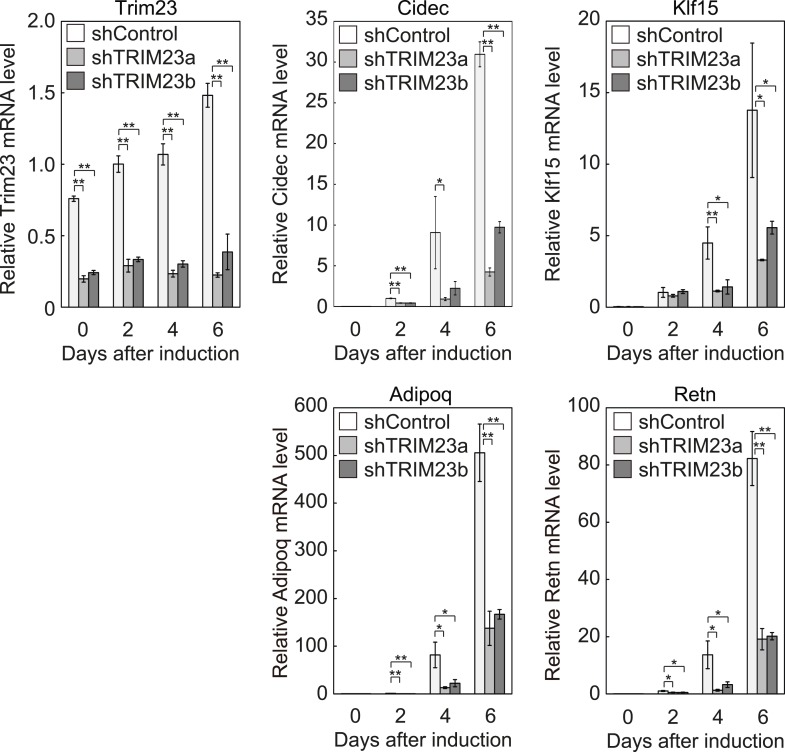
Figure 2. TRIM23 is required for 3T3-L1 adipocyte differentiation.
(A) Immunoblot analysis of TRIM23 knockdown before induction of adipogenesis is shown. (B) Cells were stained with Oil Red O to visualize the accumulation of lipid droplets at day 6. (C) The amounts of intracellular triacylglyceride (TG) were quantified at day 6. (D) RNA levels of Gtf2b and Fabp4 were determined by real-time PCR at days 0, 2, 4 and 6. Expression level of each gene was normalized to that of the Gtf2b. (E) Schematic representation of the Fabp4 gene. The locations of the sequences amplified in the ChIP are shown at the bottom in base pairs relative to the Fabp4 transcriptional start site. (F, G and H) ChIP analysis of PPARγ (F), MED1 (G), and Pol II (H) on the Fabp4 gene during adipocyte differentiation. Ct values of each ChIP were normalized to that of input. All data represent means ± s.d. from three independent experiments. The p values for the indicated comparisons were determined by Student's t test (*, p < 0.05; **, p < 0.01).


