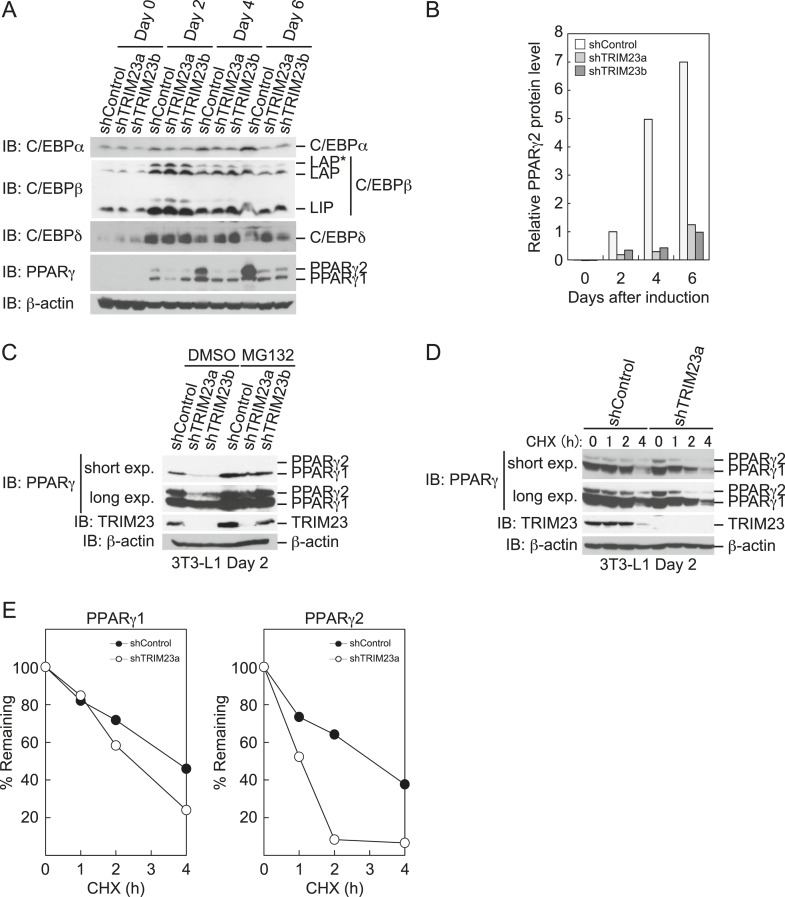
Figure 7. TRIM23 stabilizes PPARγ2.
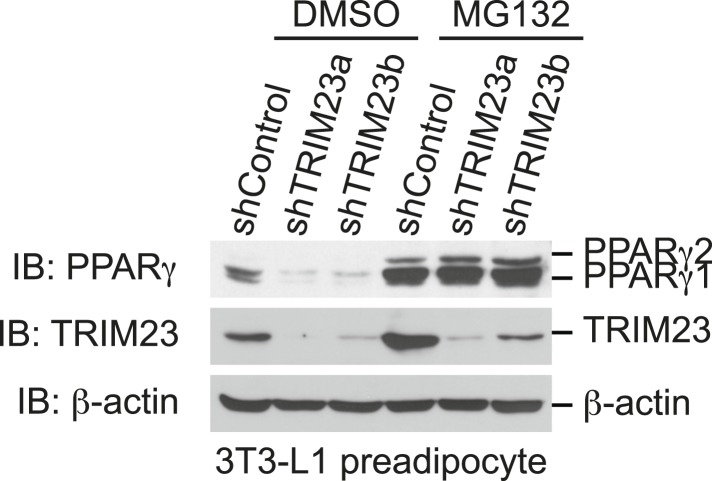
(A) Immunoblot analysis of C/EBPα, C/EBPβ, C/EBPδ and PPARγ proteins during 3T3-L1 cell differentiation. (B) The intensity of the immunoreactive bands of PPARγ2 obtained by immunoblot analysis with anti-PPARγ antibody was determined relative to that obtained with anti-β-actin antibody. (C) Immunoblot analysis of PPARγ protein in the absence and presence of MG132. 3T3-L1 cells with stable knockdown of TRIM23 or the corresponding control cells were differentiated by the differentiation cocktail for 48 hr and subsequently treated with 10 μM of MG132 for 6 hr (D) 3T3-L1 cells with stable knockdown of TRIM23 or the corresponding control cells were differentiated by the differentiation cocktail for 48 hr and subsequently treated with 10 μM of MG132 for 6 hr, followed by cycloheximide (CHX) treatment (5 μM) for 0, 1, 2 or 4 hr. The cell lysates were subjected to immunoblot analysis with an anti-PPARγ, anti-TRIM23 or anti-β-actin antibody. β-actin is shown as a loading control. The result is representative of two independent experiments. (E) The intensity of the PPARγ1 and PPARγ2 bands was normalized to that of the corresponding β-actin bands shown in (D) and is indicated as a percentage of the normalized value at 0 hr.


