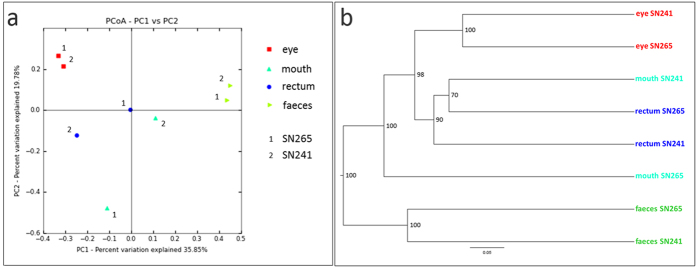
Figure 2. Principal Coordinate Analysis (PCoA) and UPGMA tree of Unifrac distances of the eye, mouth, rectal and faecal samples of two captive koalas.

Panel A represents a 2 dimensional unweighted PCoA plot by sample type. Panel B represents the UPGMA clustering on unweighted Unifrac distances. Nodal supports were assessed by jackknife using 1,000 replicates. The two plots highlight that the samples tended to cluster by body region but not by koala specimen.
