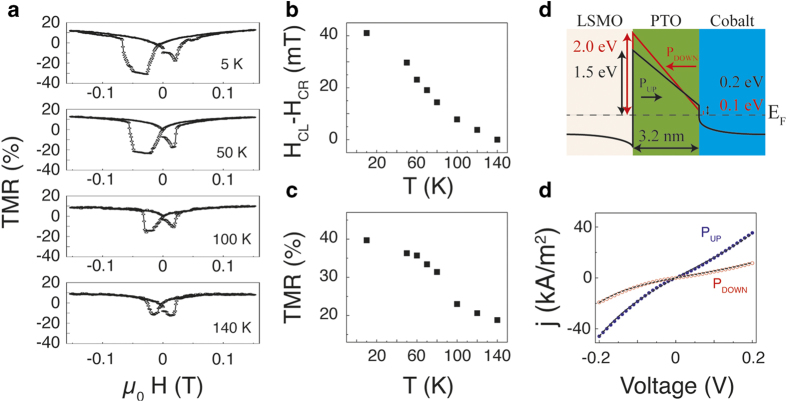
Figure 3.
(a) TMR loops for different temperatures, showing a decrease in asymmetry until it becomes symmetric around 140 Kelvin. (b, c) Dependence of the asymmetry (coercive field “left” side (HCL) minus coercive field “right” side (HCR)) and TMR on temperature. (d) Schematics of the band structure according to the results obtained from the fitting parameters in e. (e) IV- characteristic curves after switching the ferroelectric polarization with electric pulses of 3 V and 100 μs. The blue and red points represent measurements for low and high resistance states of the respective junctions with ferroelectric polarization pointing towards and away from the cobalt electrode, respectively. The black dashed lines inside the figures are fits on the data with the Brinkman model. All measurements were performed at 5 Kelvin.

