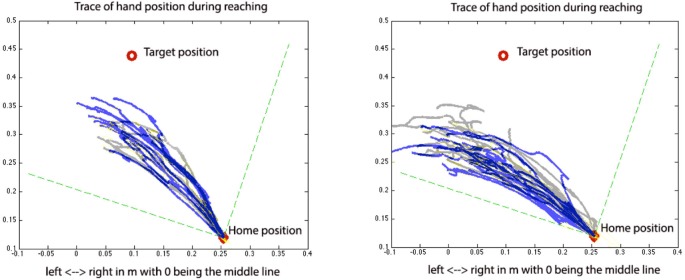
Figure 2.

Pre (gray) and post (blue) tDCS reaching trials for a-tDCS over the lesioned side with 25% of the MVT shoulder load (left) and c-tDCS over the non-lesioned side with 50% of the MVT shoulder load (right). In this figure, the gray and blue traces represent the traces of hand position pre- and post-tDCS, respectively.
