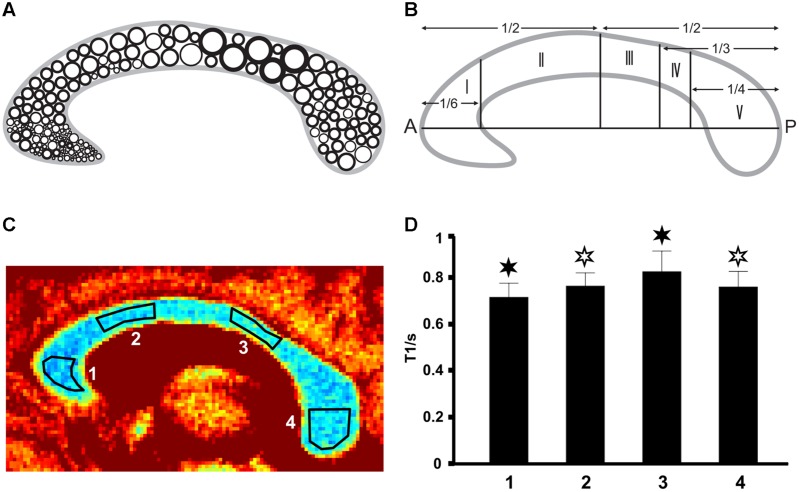
FIGURE 1.
(A) Fiber composition in the midsagittal corpus callosum (CC; modified after Aboitiz et al., 1992) with large circles representing thick fibers and small circles representing thin fibers. (B) Geometric parcellation of the CC (Hofer and Frahm, 2006) with I = prefrontal, II = premotor and supplementary motor, III = primary motor, IV = primary somatosensory, and V = parietal, temporal, occipital. (C) Color-coded T1 map of the CC (subject VII) with ROI definitions: low T1 values are in blue and high T1 values appear in red. (D) Corresponding mean T1 relaxation times in the four regions (subject VII). Filled asterisks indicate significant differences to all other areas, open asterisks indicate significant differences to other areas except to the second area marked with an open asterisk.

