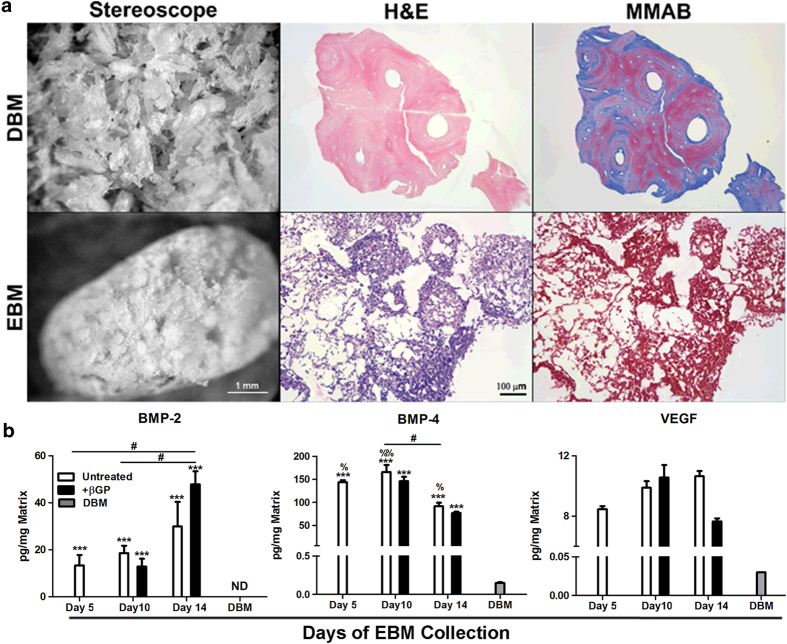
Figure 1. Characterization of DBM and EBM.
DBM and day 10 EBM structure and composition were examined macroscopically (left panel, scale bar = 1 mm) and microscopically (center panel: H&E and right panel: modified MMAB, scale bar = 100 μm) to reveal their material architectures and collagen content (a). EBM derived from EBs without or with βGP-treatment started on day 5 of EB formation was harvested at D5, D10, and D14. Growth factors extracted from both EBM and DBM were quantified by ELISA (b). The error bars represent standard error of the mean. n = 3 samples, Box-Cox transformation, ANOVA, Tukey’s post-hoc test, ***p < 0.005 compared to DBM, #p < 0.05 for marked comparison, %p < 0.05, %%p <0.01 compared to Day 14 +βGP EBM. ND: not detectable.

