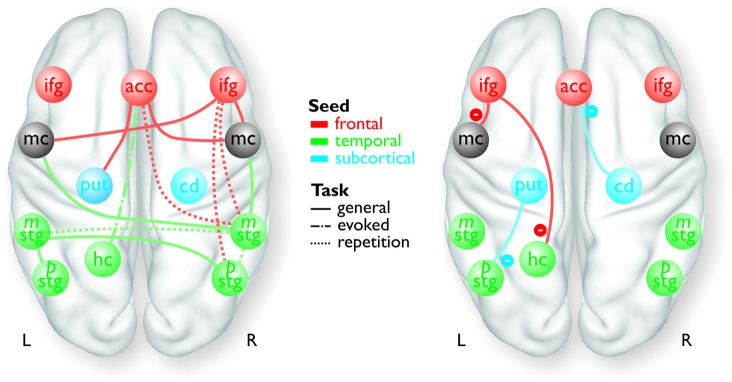
Figure 1.

Overview of the frontal (red), temporal (green), and subcortical seed regions (blue) included in the PPI analyses, except for the bilateral MC and the right pSTG, which only resulted as target regions in the analyses. The connections between the regions represent a summary of the functional pathways with positive functional connectivity (left panel) and with negative functional connectivity (right panel) as determined by the PPI analyses. The color of the pathways is according to the color of the seed region.
