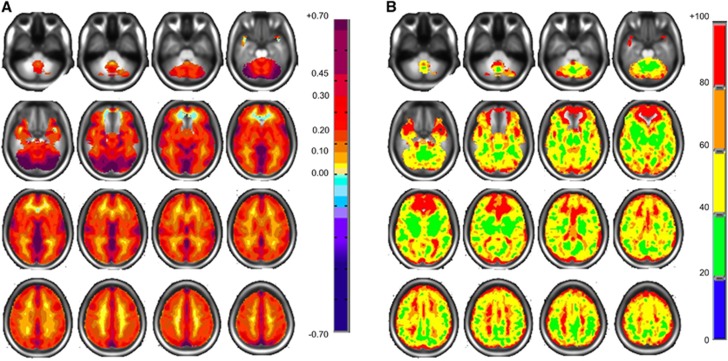
Figure 1.
Axial slices for the normal cohort atlas displaying spatial distributions. (A) Mean CVR values colored according to the scale shown on the right in percentage of BOLD change per mm Hg PETCO2 change. (B) Coefficient of variation values with color scale on right in percentage. BOLD, blood oxygen level-dependent; CVR, cerebrovascular reactivity; PETCO2, end-tidal partial pressure of CO2.

