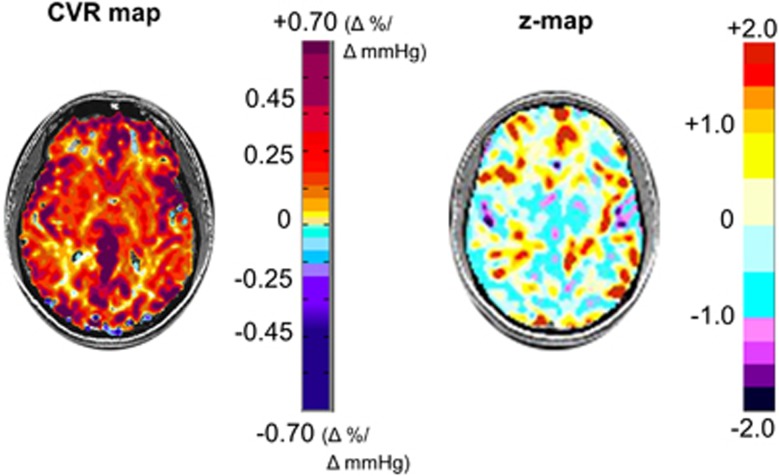
Figure 3.
An axial slice from a healthy subject's CVR map is shown on the left displaying the spatial distribution of CVR values colored according to the scale shown on the right in percentage of BOLD change per mm Hg PETCO2 change. The corresponding CVR z-map and its color scale are shown on the right. The CVR z-map provides a perspective on the (statistical) normality of CVR in the CVR map. This figure illustrates the extent of expected high statistical abnormality, as a result of physiologic, technical (both experimental and analytical), and anatomic variation in the subject as well as errors in the matching of voxels during coregistration. BOLD, blood oxygen level-dependent; CVR, cerebrovascular reactivity; PETCO2, end-tidal partial pressure of CO2.

