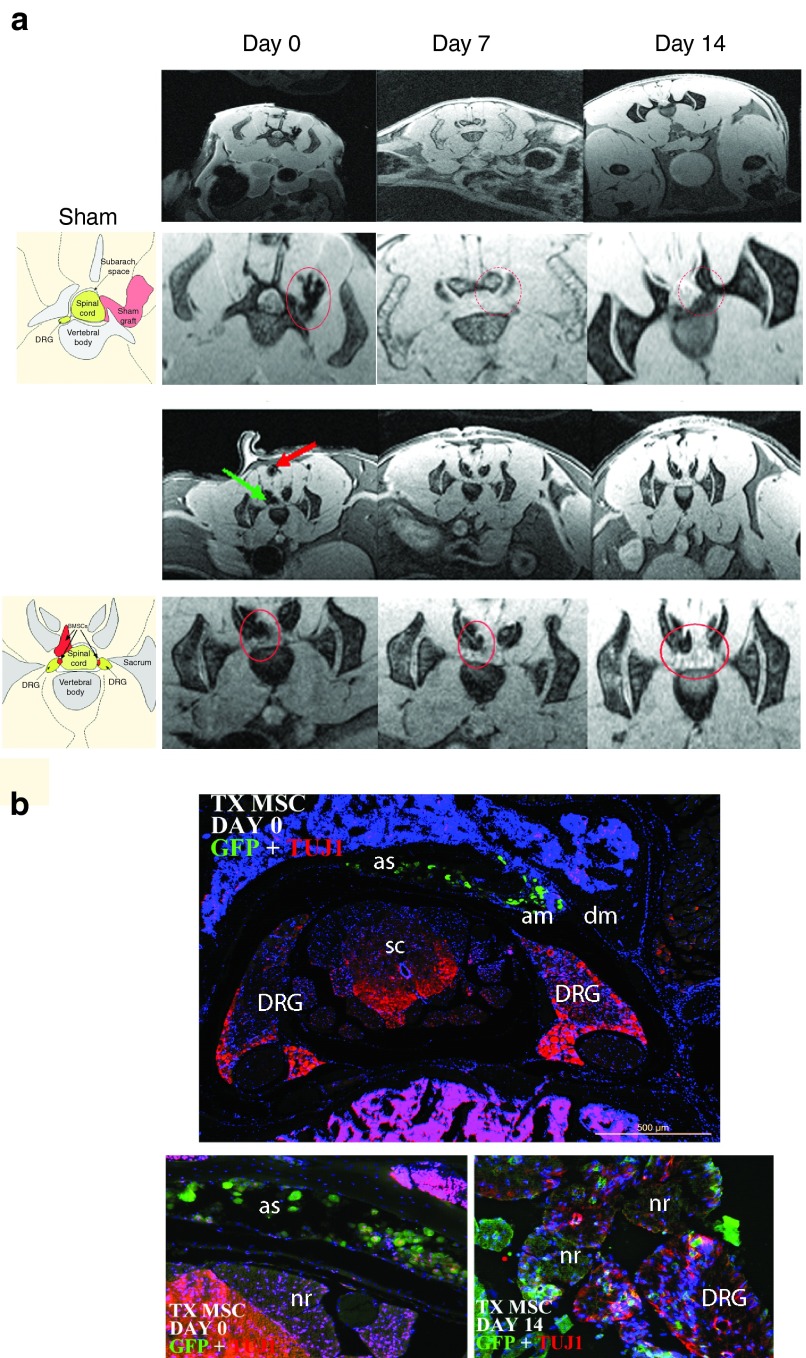
Figure 2.
Magnetic resonance imaging (MRI) of the YG8 mice. (a) MRI of vehicle-injected (sham) and YG8 mice treated with mesenchymal stem cells of GFP mice (TX MSC), analyzed at days 0, 7, and 14 postsurgery. In the TX MSC groups, the stem cells can be observed due to the presence of iron nanoparticles in the cells (see red and green arrows at day 0). The second row of images in the sham and TX MSC correspond to close-ups of the spinal cord observed in the first row of images. In the sham group, a dark staining to the right of the spinal cord can be observed at day 0, corresponding to hemorrhage due to the surgical intervention (red circle), which disappears at days 7 and 14. In the TX MSC group, dark staining is observed in the spinal cord (green arrow), and the path of the needle (red arrow and red circle). Both stains remain at 7 and 14 days, corresponding to the injected stem cells (red circle), although the marked cells in the muscle progressively lose signal intensity while the ones in the spinal cord remain. The images to the left (below the SHAM and TX MSC titles) are drawings identifying the various anatomical parts of the MRI images. (b) Immunohistochemistry of TX MSC-treated mice, performed at day 0 and 14 postsurgery. At day 0, the grafted cells were observed in the subarachnoid space, while at day 14, many cells were detected in the dorsal root ganglia. In the images, green is GFP (mesenchymal stem cells), red is Tuj1, and blue is DAPI staining. Similar results were observed in MRIs of four mice. AM, arachnoid mater; AS, arachnoid space; DM, dura mater; DRG, dorsal root ganglia; NR, nerve root; SC, spinal cord.

