Figure 3.
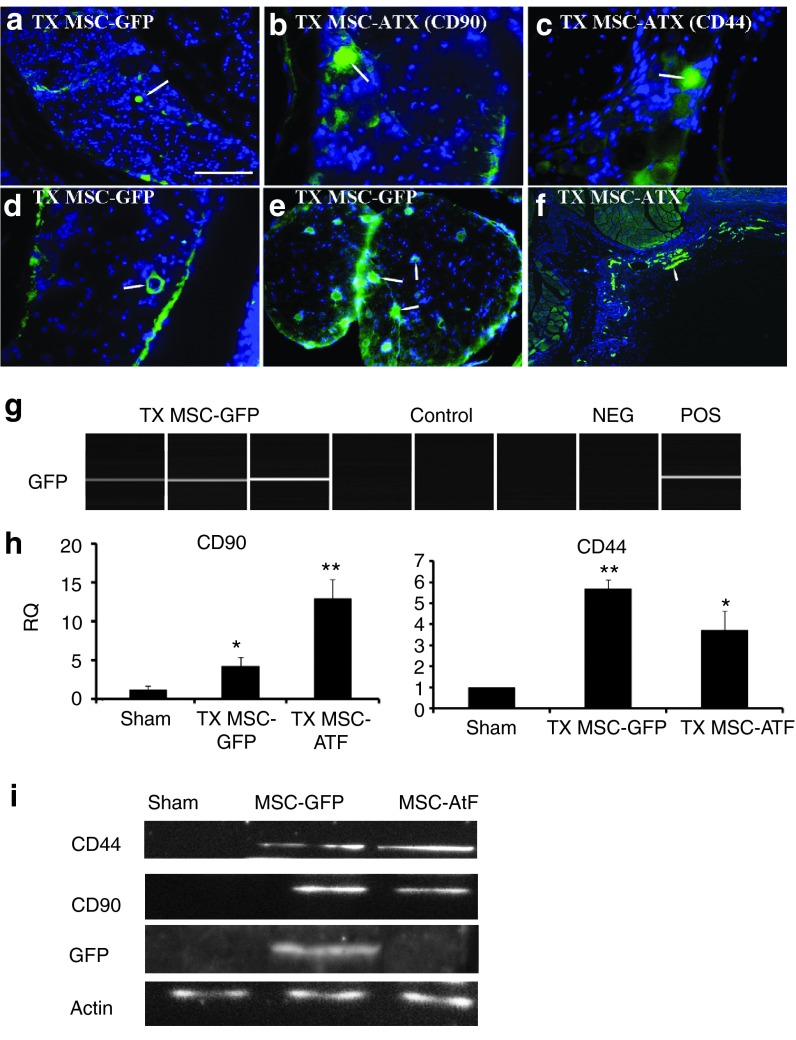
Analysis of stem cell markers in the dorsal root ganglia. (a–f) Immunohistochemical staining of the dorsal root ganglia (DRG) of YG8 mice treated with mesenchymal stem cells (labeled with an arrow). (a) DRG of an YG8 mouse where GFP-expressing mesenchymal stem cells were grafted (in green, blue is nuclear DAPI staining). (b,c) DRG of YG8 mice where mesenchymal stem cells isolated from ataxic mice were grafted, staining for specific markers CD90 and CD44, respectively. (d) Stem cells in a DRG surrounding a blood vessel. (e) Stem cells in the nerve root. (f) Stem cells from YG8 mice detected in the inner wall of the spinal cord (in the subarachnoid space). (g) GFP expression as analyzed by PCR in the TX MSC-GFP and control groups. Each lane corresponds to an individual mouse. Non-GFP and GFP mesenchymal stem cells were used as negative and positive controls (NEG, POS), respectively. (h) CD90 and CD44 expression analyzed by QPCR. RQ, relative quantity. (i) Western blot analysis of CD44, CD90, and GFP, using actin as control. Scale bar = 100 µm in a and e, 50 µm in b–d, and 250 µm in f. n = 4 in each case. *P < 0.05; **P < 0.001.

