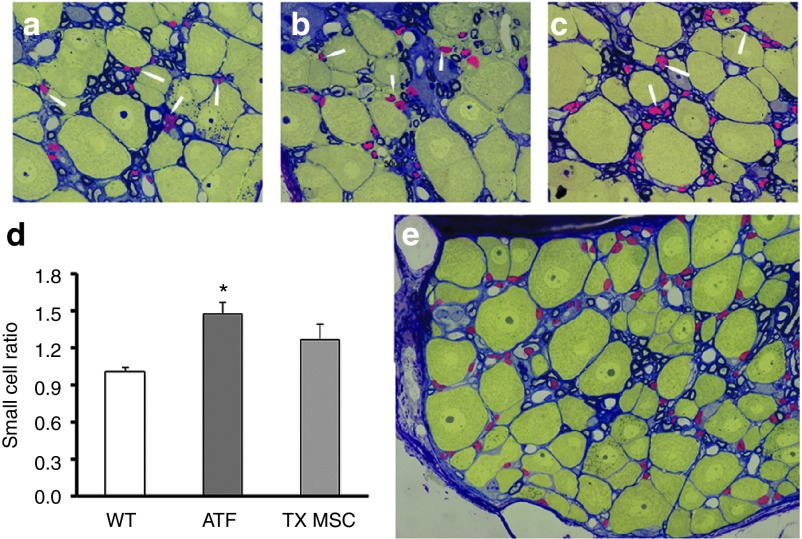
Figure 4.
Small cell to large cell ratio of the dorsal root ganglia. (a–c) Semi-thin images of the dorsal root ganglia of (a) wild-type, (b) YG8, and (c) stem cell-grafted YG8 mice, analyzed 5 months after injection. Arrowheads indicate satellite cells (in red, yellow cells indicate neurons). (d) Histogram depicting the ratio of small cells to large cells in each group of mice (ATX, YG8 mice; TX MSC, stem cell-treated YG8 mice; WT, wild-type mice). n = 3 in each case. *P < 0.05. (e) Dorsal root ganglia indicating by colors the small cells (in red) and large cells (in yellow) that were counted. The small cells are primarily satellite cells, while the large cells are neurons.

