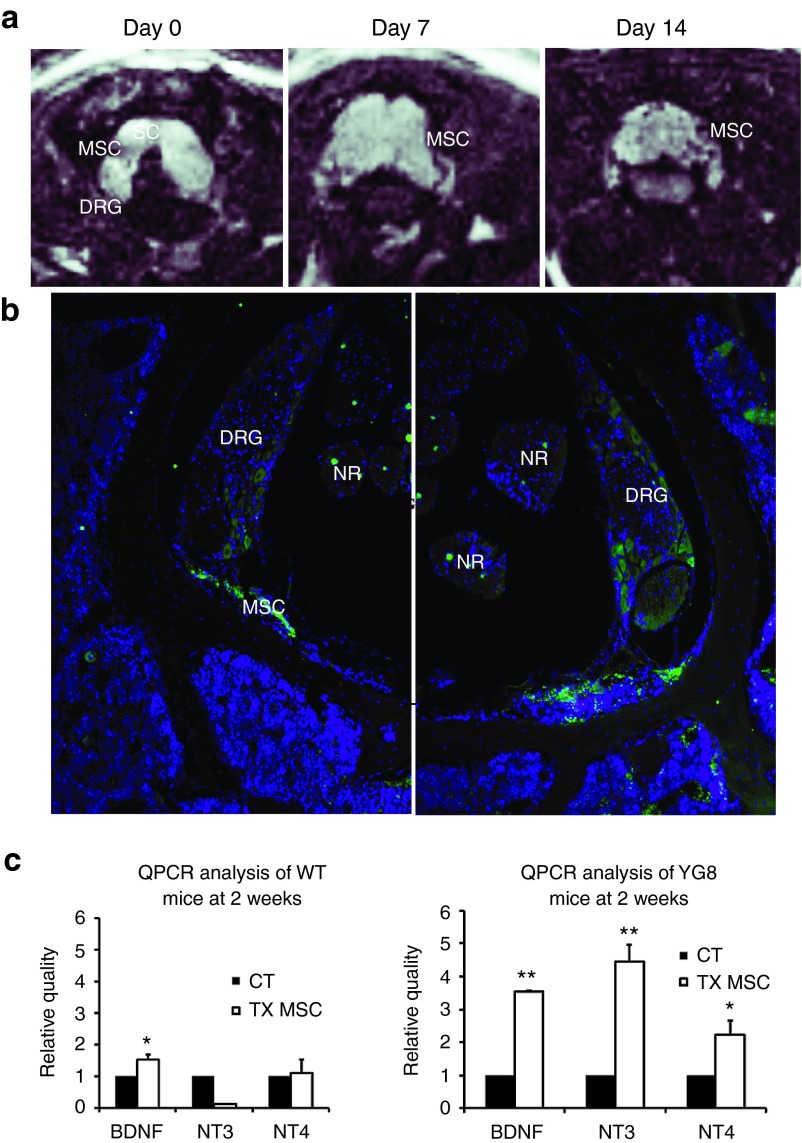
Figure 7.
Stem cell injection in the spinal cord of wild-type mice. (a) MRI images of the superparamagnetic iron oxide-incubated stem cells in the spinal cord of wild-type mice, at days 0, 7, and 14. The stem cells can be observed as dark spots in the spinal cord region. (b) Immunohistochemistry for GFP, staining the grafted stem cells, 2 weeks after injection. No grafted cells were detected in the DRG. Images taken at ×100. DRG, dorsal root ganglia; MSC, mesenchymal stem cells; NR, nerve root; SC, spinal cord. (c) QPCR analysis of neurotrophic factor expression in the dorsal root ganglia of control mice (CT) versus those treated with mesenchymal stem cells (TX MSC) in wild-type (left histogram) and YG8 (right histogram hosts). n = 4 in all cases. *P < 0.05; **P < 0.01.

